Wild claims about electricity used by computers that just won't die (but should)

Mark P. Mills has reappeared, and remarkably is repeating some of the same wild claims that we debunked last time (circa 1999-2003).  As a public service, I’ve listed the most important documents summarizing the previous controversy for the benefit of media folks and other interested parties who otherwise would have a hard time piecing it all together.  Bottom line:  Mr. Mills has made so many incorrect claims that he simply shouldn’t be treated as a serious participant in discussions about electricity used by information technology (IT) equipment.  He cherry picks numbers to suit his narrative, and creates the appearance of doing real research by including many footnotes, but almost invariably he overestimates the amount of electricity used by IT equipment.  Last time many important people were misled by his antics–I hope they are smarter this time.

1) Read the Epilogue to the 2nd edition of my book Turning Numbers into Knowledge, which is a good overall summary of the controversy and its resolution.

Koomey, Jonathan. 2008. Turning Numbers into Knowledge:  Mastering the Art of Problem Solving. 2nd ed. Oakland, CA: Analytics Press.

2) Here’s the initial article in Forbes in 1999:

Huber, Peter, and Mark P. Mills. 1999. “Dig more coal—the PCs are coming.” In Forbes. May 31. pp. 70-72. [http://www.forbes.com/global/1999/0531/0211100a.html]

3) The Forbes article got the most attention, but it was supported by another report.  Email me directly for a copy of this one.

Mills, Mark P. 1999. The Internet Begins with Coal:  A Preliminary Exploration of the Impact of the Internet on Electricity Consumption. Arlington, VA: The Greening Earth Society.  May.

4) Amory Lovins posted an exchange of emails between him and Mills in 1999 (with a few others of us as occasional participants or observers).  It’s downloadable here:

Exchanges between Mark Mills and Amory Lovins - Rocky Mountain …

5) My colleagues and I at LBNL did an initial analysis memo soon after the Forbes article came out:

Koomey, Jonathan, Kaoru Kawamoto, Bruce Nordman, Mary Ann Piette, and Richard E. Brown. 1999. Initial comments on ‘The Internet Begins with Coal’. Berkeley, CA: Lawrence Berkeley National Laboratory. LBNL-44698.  December 9. [http://enduse.lbl.gov/SharedData/IT/Forbescritique991209.pdf]

6) Mills did congressional testimony on Feb 2, 2000, and I did an annotated rebuttal.

Koomey, Jonathan G. 2000. Rebuttal to Testimony on ‘Kyoto and the Internet: The Energy Implications of the Digital Economy’. Berkeley, CA: Lawrence Berkeley National Laboratory. LBNL-46509.  August. [http://enduse.lbl.gov/Info/annotatedmillstestimony.pdf]

7) Huber and Mills published a widely read op-ed in the WSJ in 2000, which is where they talked about the network electricity for a Palm pilot using as much electricity as a fridge.

Huber, Peter, and Mark P. Mills. 2000. “Got a Computer?  More Power to You.” Wall Street Journal.  New York, NY.  September 7. p. A26. [http://www.manhattan-institute.org/html/miarticle.htm?id=4524]

8) My former group at LBNL did a careful bottom up analysis of US IT electricity use, finding much lower numbers than did Mills, and publishing in the peer reviewed Energy-the International Journal in 2002 (Email me for a copy of this one):

Kawamoto, Kaoru, Jonathan Koomey, Bruce Nordman, Richard E. Brown, Maryann Piette, Michael Ting, and Alan Meier. 2002. “Electricity Used by Office Equipment and Network Equipment in the U.S."  Energy–The International Journal (also LBNL-45917).  vol. 27, no. 3. March. pp. 255-269.

9) Kurt Roth at ADL did a study that validated the work in item #7.

Roth, Kurt, Fred Goldstein, and Jonathan Kleinman. 2002. Energy Consumption by Office and Telecommunications Equipment in Commercial Buildings–Volume I:  Energy Consumption Baseline. Washington, DC: Prepared by Arthur D. Little for the U.S. Department of Energy. A.D. Little Reference no. 72895-00.  January. [http://www.mediafire.com/?75ykfz6rdmex11s]

10) I and other colleagues published an article titled "Sorry, wrong number” in which we described the Mills’ estimates as one of several examples of widely cited energy statistics that were wildly wrong (Email me for a copy of this one).

Koomey, Jonathan, Chris Calwell, Skip Laitner, Jane Thornton, Richard E. Brown, Joe Eto, Carrie Webber, and Cathy Cullicott. 2002. “Sorry, wrong number:  The use and misuse of numerical facts in analysis and media reporting of energy issues."  In Annual Review of Energy and the Environment 2002. Edited by R. H. Socolow, D. Anderson and J. Harte. Palo Alto, CA: Annual Reviews, Inc. (also LBNL-50499). pp. 119-158.

11) I wrote a 2 page summary article, also titled "Sorry, wrong number” but with a different subtitle, describing why getting the numbers right on this topic really matters, and giving advice to help people avoid getting fooled by charlatans (Email me for a copy of this one).

Koomey, Jonathan. 2003. “Sorry, Wrong Number:  Separating Fact from Fiction in the Information Age.” In IEEE Spectrum. June. pp. 11-12.

12) In the last of our detailed debunkings, we dissected the “network electricity use of a wireless PDA is more than that of a refrigerator” myth perpetuated by Mr. Mills, with a little help from my friends at Palm (Email me for a copy of this one).

Koomey, Jonathan, Huimin Chong, Woonsien Loh, Bruce Nordman, and Michele Blazek. 2004. “Network electricity use associated with wireless personal digital assistants."  The ASCE Journal of Infrastructure Systems (also LBNL-54105).  vol. 10, no. 3. September. pp. 131-137.

13) There’s an LBNL site that contains a lot of relevant material, but it hasn’t been updated since I left LBNL in 2003:  http://enduse.lbl.gov/Projects/InfoTech.html

Addendum:

14) Joe Romm just reminded me of the article he did for a Rand conference that ultimately ended up in a refereed journal (Resources, Conservation, and Recycling), in which he analyzed Mills’ claims from a macro perspective, and showed that the only way those could be true would be if electricity intensity of the economy was increasing after the advent of the Internet, but of course the exact opposite was true.  This argument was summarized in Item 10, above.

Romm, Joe. 2002. "The Internet and the new energy economy."  Resources, Conservation, and Recycling.  vol. 36, no. 3. October. pp. 197-210. [http://www.sciencedirect.com/science/article/pii/S0921344902000848]

To download the conference paper version from Rand for free, go to http://192.5.14.43/content/dam/rand/pubs/conf_proceedings/CF170z1-1/CF170.1.romm.pdf

15) Also important is this article by Romm et al. that discusses the broader systemic effects that the Internet enables.

Romm, Joe, Arthur Rosenfeld, and Susan Herrmann. 1999. The Internet Economy and Global Warming. Washington, DC: Center for Energy & Climate Solutions.   [http://infohouse.p2ric.org/ref/04/03784/0378401.pdf]
An open letter to Google about their fundraiser for Senator James Inhofe

Some colleagues and I, all of whom were Google Science Communication Fellows in 2011, wrote and posted at Climate Science Watch an open letter to Eric Schmidt and Larry Page of Google about their fundraiser for Senator James Inhofe.  You can read the letter here.

Four of us also wrote a more extensive essay, which Andy Revkin posted at his Dot Earth blog.  We’re hopeful that our efforts will stimulate discussion of how corporate america should deal with those (like Senator Inhofe) who deny the reality of climate change.

Comments welcomed!

Here’s the link to the open letter:

http://www.climatesciencewatch.org/2013/08/01/open-letter-from-google-science-communication-fellows/

Here’s the link to the longer essay:

http://dotearth.blogs.nytimes.com/2013/08/01/google-science-fellows-challenge-companys-support-for-inhof/?_r=1&

Addendum, August 1, 2013 8:15pm:  There’s an article describing the open letter on Climate Progress that has more than 3100 Facebook “likes”, which is more than any other article with which I’ve ever been associated.

The headline is slightly misleading, as we’re not “Google’s own scientists”, but it’s still worth a read.

My Technology Review  article called “The Computing Trend that Will Change Everything” received 1100 Facebook likes and the editors thought it was a blockbuster.  Getting a tweet from Vinod Khosla (and lots of others) helped in that instance.  Given that it’s got more than three times as many “likes”, I think it’s fair to say that the open letter to Google has gone viral.

Apple patent points to the future of power management for mobile computing devices

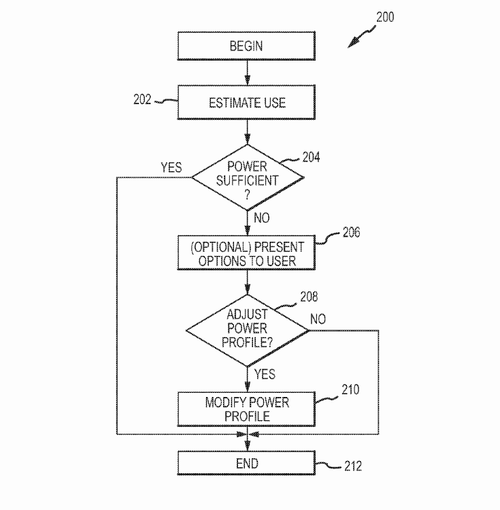
This Apple patent points to the future of power management for mobile computing devices.  Devices will use context-specific information (like estimating how far you are from your destination using the GPS in your phone) to help decide when to reduce power use and extend battery life.  Smart everything, getting smarter all the time!

Mac Rumors:  Apple Applies for Patent on Intelligent ‘Power Management for Electronic Devices’
A newly published patent application from Apple describes a “power management for electronic devices” system, which detects the usage…
image

An outstanding gadget for anyone who wants to learn about temperature and heat flow

Because of the recent heat wave around here, I’ve been trying to figure out how to keep our house from heating up so much.  I started using a Maverick Laser Surface Thermometer to learn more about heat flows and temperatures inside the house.  It retails for about $35 on Amazon, and is incredibly useful, in part because it gives you a nearly instantaneous temperature measurement of surfaces up to 5 feet away.  The claim is that it can measure temperatures from -58 degrees F to 1022 degrees F, and is useful for cooking as well as home energy work.

image

For example, my contractor suggested putting up some reflective foil insulation on the inside of the attic ceiling.  To test this idea, I thumbtacked a sample of the insulation onto the inside of the roof in the attic and put the laser thermometer to work.  Sure enough, the reflective insulation reduced the surface temperature by 5-6 degrees F compared to the plywood next to it.

I also randomly started aiming the laser at different parts of the wall, and found that our downstairs thermostat is on the opposite side of the wall from our garage water heater, and so registers about 2 degrees F higher than the interior wall and the associated air temperature.  Good to know!

Of course, lasers aren’t for kids, so be sure to keep this tool in a safe place, but if you are at all interested in where your heat is going, this device can help.

Our article in Nature Climate Change just came out: Characteristics of Low Carbon Data Centres

This article gives a tidy summary of the key factors affecting the greenhouse gas emissions associated with data centers, and helps readers prioritize how best to reduce those emissions.  The three areas for improvement are the efficiency of the information technology (IT) equipment (servers, storage, and communications), the efficiency of the infrastructure equipment (fans, cooling, pumps, power distribution), and the carbon intensity of electricity production.

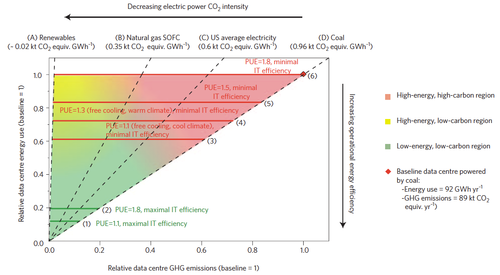
These factors can be conveniently pictured using what we call a “data center energy-carbon performance map” like the one shown in Figure 1:

image

Figure 1:  The data center energy-carbon performance map.  The shaded area bounds the potential operational energy and carbon performance range of a prototype US data centre and illustrates the relative performance of different data centre characteristics. Coloured areas indicate general regions of energy–carbon performance. For some data centres, only subareas of this map will apply depending on equipment and electrical power constraints. Numbered points are discussed in the text of the article. See section S2 of the Supplementary Information for details. GHG=greenhouse gas, PUE= Power Utilization Effectiveness.  Download a larger version.

The prototypical data center powered by coal-fired electricity is in the upper right hand corner, while the best place for a data center to be is in the lower left hand corner (high IT efficiency, low energy, low emissions).  Note that you can have a high energy, high emissions facility with very low Power Utilization Effectiveness (PUE, the industry standard metric for infrastructure losses.  A PUE of 1.0 represents zero infrastructure energy losses, with typical existing “in-house” facilities having PUEs of 1.8 or 1.9.  In those facilities, there is 0.8-0.9 kWh of infrastructure overhead for every kWh of IT load).

The critical lesson from the analysis is that IT efficiency (which includes higher utilization and performance improvements as well as purchasing efficient hardware) is the most important issue on which to focus.  Most recent efforts in the industry have been on improving infrastructure efficiency, which has many beneficial effects, but is not as important a lever as is the IT efficiency (in many new facilities we are reaching the limits of infrastructure efficiency, with PUEs as low as 1.04).  The article also makes clear that just switching an inefficient data center to low carbon electricity isn’t a good choice, because it uses up scarce low carbon electricity that could otherwise be used elsewhere.

Here’s the key paragraph from the conclusions:

Here we offer the following recommendations to policymakers who seek to design effective incentives for low-carbon data centres: all existing data centres should maximize IT-device efficiency, especially as these devices can turn over quickly and thereby deliver rapid improvements. Decisions regarding when to upgrade remaining devices to more efficient models can be informed in part by a break-even analysis of the embodied emissions required to manufacture new devices versus the operational energy savings that would be realized. New data centres should locate in areas with ample free cooling and/or low-carbon electricity grids to further push operations towards better energy and carbon performance. In new or existing facilities where optimal IT-device efficiency is not feasible, significant reductions in PUE critically rise in importance as a policy aim (but still result in higher energy-use levels than efficient IT devices would deliver). Where such PUE reductions are constrained by location (for example, a lack of free cooling), procuring low-carbon electricity — either from local electricity providers or through the installation of reduced-carbon self-generation such as Solid Oxide Fuel Cells — becomes the next chief lever after energy efficiency has reached its practical limit. With these insights in mind, public- and private-sector policymakers can accelerate the transition to a low-carbon Internet by aligning their incentives with data centre characteristics that matter.

The article summarizes some important lessons for those thinking about low emission data centers, and I highly recommend reading it if you are interested in this area.  It’s a short, crisply written paper, and one that should yield real insight if you’re thinking deeply about these issues.  Please email me if you’d like a copy (it’s behind a paywall).

Masanet, Eric, Arman Shehabi, and Jonathan Koomey. 2013. “Characteristics of Low-Carbon Data Centers."  Nature Climate Change.  vol. 3, no. 7. July. pp. 627-630. [http://dx.doi.org/10.1038/nclimate1786 and http://www.nature.com/nclimate/journal/v3/n7/abs/nclimate1786.html#supplementary-information]

Addendum:  Katie Fehrenbacher of GigaOm just wrote a short summary of the article.

Barack Obama, Climate Hawk!

Barack Obama, Climate Hawk!

More context at http://thinkprogress.org/climate/2013/06/25/2213341/invest-divest-obama-goes-full-climate-hawk-in-speech-unveiling-plan-to-cut-carbon-pollution/

The back story about “The Fatal Flaw in the Case for Keystone”

For many months I struggled with what to think about the Keystone pipeline.  On the one hand, my friends in the Administration and elsewhere argued persuasively (at least on first blush) that the oil from the tar sands would be sold one way or another, so whether the pipeline was completed or not didn’t make any difference from a climate perspective.  On the other hand, I was instinctively skeptical of building infrastructure to high carbon resources that we simply don’t have the luxury to burn if we hope to stabilize the climate.

What I came to realize was that the first point of view was based on a flawed framing of the problem, which led me to write the op-ed titled “The Fatal Flaw in the Case for Keystone”.  The purpose of this short note is to explain the underlying intellectual roots of that framing (and the circular reasoning it engendered), so students of these matters can dig deeper and avoid making such mistakes in the future.

Neoclassical economics has taught us a lot about how economies work, but it is based on a set of assumptions that often don’t reflect economic decisionmaking in the real world.  For example, most economic models assume perfect & costless information, perfect competition, no externalities, no transaction costs, and constant or decreasing returns to scale.   In this world, it is sufficient to show that there’s a price difference between (for example) Alberta Tar Sands oil and similar heavy oil from other places, and to state that market forces won’t let that price difference persist.  That’s, in essence, what it means to state that “the Alberta tar sands oil will be sold anyway”.

In the real world, however, information is imperfect and costly, transaction costs can be large, and increasing returns to scale are pervasive.  These (and other) factors lead to what’s called “path dependence”, meaning that our choices now affect our options later.  For example, if we invest in deploying mass produced technologies (like solar panels and wind turbines) we move down the learning curve, thus reducing the costs of those technologies five or ten years hence.  If we deploy fewer of those devices, we don’t move as far down the learning curve and their costs in 2020 will be higher than they would be in the case where we more actively promote deployment of these technologies.

Another source of path dependence is the nature of the climate problem itself.  Because the most important greenhouse gases stay in the atmosphere for a long time, it’s the cumulative emissions of greenhouse gases that matter.  That means that we can emit only a fixed amount of carbon (our “carbon budget”) if we want to stay under the 2 Celsius degree warming limit that the US and other major nations accepted at Copenhagen in 2009.  If we burn more high carbon fuels now, we commit ourselves to even faster reductions in emissions later (because the total carbon budget over the next century is fixed).

In the case of Keystone, path dependence matters a lot.  Right now the heavy oils from the tar sands are “landlocked”, because pipeline capacity is limited.  That means that the price of heavy oil from Alberta is much lower than comparable heavy oils (like those from Mexico, called Maya heavy oil).  This discount can be tens of dollars per barrel, and it reflects the limited transportation options for tar sands producers to move their product to market.  In the last nine months it has ranged between $20 and $40 per barrel.  Building more pipelines will allow this differential to narrow and eventually close, but the rate at which it closes depends on how fast pipeline capacity is built (it is path dependent).

The idea that “tar sands oil will be sold anyway” assumes that adequate pipeline capacity will be built to allow this outcome to come to pass, so it’s circular to argue (as the State Department’s Environmental Impact Statement does) that approving Keystone XL will have no effect on the exploitation of the tar sands.  Any one project will have a minimal effect, of course, but the cumulative effect of building enough pipelines for tar sands oil to make its way to market will be to allow greater exploitation of tar sands than would otherwise be possible.

The claim that tar sands oil will make its way to market one way or another is therefore dependent on the construction of additional pipeline capacity.  If pipelines aren’t built, then the price differentials won’t narrow and less tar sands oil will be produced than otherwise (because the profitability of exploiting this resource would be substantially reduced).  The logic in the State Department’s Environmental Impact statement about whether approving Keystone would increase exploitation of the tar sands is therefore invalid (because it’s circular).

The key issue from a climate perspective comes down to whether building more pipelines would affect the cumulative emissions from the tar sands.  The State Department’s environmental impact statement comes to one conclusion, based on the circular reasoning I identify above, but the Canadian Oil Industry comes to the opposite conclusion (as I point out in the op-ed).  If the construction of additional pipelines would affect the quantity of heavy oil extracted from the tar sands, then approving the Keystone XL pipeline (and any additional pipelines to the tar sands) is counter to the interests of climate protection, and the pipeline should therefore be rejected on that basis.

Addendum:  Given what the President said in his climate speech today, the argument I make above should sink the Keystone XL pipeline.

Addendum #2:  See these illuminating musings by Dave Roberts about President Obama’s statement about Keystone and this excellent piece by Jesse Jenkins summarizing the different possible scenarios related to Keystone.  The key quote from Jenkins:  "So can rail lines really scale up to ultimately handle a couple million barrels of new tar sands oil shipments per year?  In many ways, the Keystone debate hinges on this question.“  This quote echoes what Robert and I discuss in the comments below, which is why I’m going to delve more into the question of whether rail is truly a substitute for pipelines.

The Fatal Flaw in the Case for Keystone

The US State Department recently delayed their final decision about the Keystone XL pipeline, [1] which would transport heavy oil from Canada’s Alberta tar sands to US refineries on the Gulf coast.  Proponents of the pipeline claim that it will create many US jobs and improve US national security, but in neither case are these benefits likely to be significant. [2]  [3]  They also claim (with some justification) that the pipeline would reduce the risk of local environmental damages compared to other shipping methods, but that argument assumes that the oil will flow from Alberta one way or another.

It is this last assumption that is the fatal flaw in the arguments of pipeline proponents, but it is a view that is widely shared.  For example, the State Department’s 2013 Draft Supplemental Environmental Impact Statement assumes that approving the pipeline would have no effect on future production of tar sands:

Approval or denial of any one crude oil transport project, including the proposed [Keystone XL] Project, remains unlikely to significantly impact the rate of extraction in the oil sands, or the continued demand for heavy crude oil at refineries in the U.S.[4]

The legalistic focus on “any one crude oil transport project” guarantees that the tar sands will be exploited to their maximum potential.  Each incremental increase in pipeline capacity by itself may not contribute much to additional tar sands production, but many pipelines to the tar sands would be approved if we study each in isolation, and a significant increase in tar sands production would be the perverse result.

Conversely, we know that constraints on pipelines to the tar sands would limit overall tar sands production, because the Canadian oil industry says so.  In an explicit acknowledgement of the importance of future pipelines for increased exploitation of tar sands, the Canadian Association of Petroleum Producers recently described their forecast that Alberta oil sands production would be 2.5 million barrels per day in 2030 if “the only [pipeline] projects to proceed were the ones in operation or currently under construction”, but twice that if additional pipelines are built.[5]  This conclusion was reinforced by a recent Goldman Sachs analysis of tar sands economics.[6]

Of course, Canada may approve other “in country” pipelines to Alberta, but Transcanada chose the Keystone XL pipeline route because it was the cheapest and easiest method to move heavy oil to refineries with capacity to process it. The other options must be less desirable because otherwise Transcanada would have chosen those instead.  As a case in point, British Columbia recently rejected a pipeline to the Pacific that was one of the contingency routes in case Keystone XL was not approved.[7]

The tar sands are 14-20% more carbon polluting per unit of energy than traditional oil, when considering the full life-cycle of exploration, extraction, and consumption.[8]  Using this fuel therefore has an opportunity cost, because it yields less energy per ton of carbon emitted than other fossil fuels like natural gas, and much less than renewable sources like solar or wind (which have emissions associated with their manufacturing, installation, and decommissioning).

We can emit a fixed amount of carbon over the next few decades and stay under the two Celsius degree warming limit that the US and other major countries accepted in 2009 at Copenhagen (that’s our “carbon budget”).[9] Contrary to the arguments of Keystone proponents, approving the pipeline (and the ones that will inevitably follow) will accelerate exploitation of the tar sands and eat up the remaining carbon budget more rapidly than would alternatives. That’s why the pipeline is counter to the interests of the US and the world, and why the US State Department should not approve its completion.

Ultimately, we’ll need to do what former CIA director Jim Woolsey recommends: turn oil into salt.[10]  That formerly strategic commodity is now something we buy cheaply at the supermarket, made so by alternatives (like refrigeration) that rendered its former use in meat preservation obsolete.  We need to buy time until we can more widely deploy alternatives to fossil fuels, and slowing the exploitation of tar sands is one good way to do just that.

________________________________________________

Jonathan Koomey, Ph.D., is a Research Fellow at the Steyer-Taylor Center for Energy Policy and Finance at Stanford University.  He’s also the author of Cold Cash, Cool Climate:  Science-based Advice for Ecological Entrepreneurs (Analytics Press, 2012) and coauthor of Energy Policy in the Greenhouse (John Wiley and Sons, 1992).


[1] State Department decision delayed to late 2013 or early 2014:  http://www.reuters.com/article/2013/05/11/us-usa-keystone-delay-idUSBRE94A00T20130511

[2] the number of permanent jobs associated with operating the pipeline number in the dozens, while the direct employment from pipeline construction totals 3,900 temporary jobs lasting one to two years (US Department of State. 2013. Draft supplemental Environmental Impact Statement for the Keystone XL Project.  March. [http://keystonepipeline-xl.state.gov/draftseis/index.htm], Executive Summary, p. ES-14.)  In neither case is the number significant for the US economy, which created about 750,000 jobs in the first four months of 2013.  http://www.bls.gov/news.release/empsit.b.htm

[3] Oil trades on a global market where supply and demand determines prices, so there is little demonstrable national security impact from substituting Canadian heavy oil for that shipped from other countries. Replacing oil with alternatives is the only sure way to reduce significantly the risks associated with oil dependency (Lovins, Amory B., E. Kyle Datta, Odd-Even Bustnes, Jonathan G. Koomey, and Nathan J. Glasgow. 2004. Winning the Oil Endgame:  Innovation for Profits, Jobs, and Security. Old Snowmass, Colorado: Rocky Mountain Institute.  September. [http://www.oilendgame.com])

[4] US Department of State. 2013. Draft supplemental Environmental Impact Statement for the Keystone XL Project.  March. [http://keystonepipeline-xl.state.gov/draftseis/index.htm], p.1.4-1.

[5] CAPP. 2012. Crude Oil:  Forecast, Markets, and Pipelines. Calgary, Canada:  June. [http://www.capp.ca/forecast/Pages/default.aspx]

[6] http://online.wsj.com/article/SB10001424127887324069104578531713102125222.html

[7] http://www.guardian.co.uk/environment/2013/jun/01/tar-sands-canada-pipeline-enbridge

[8] Lattanzio, Richard K. 2013. Canadian Oil Sands: Life-Cycle Assessments of Greenhouse Gas Emissions. Washington, DC: Congressional Research Service.  March 15. [http://www.fas.org/sgp/crs/misc/R42537.pdf]

[9] Koomey, Jonathan, and Florentin Krause. 2009. Why 2 degrees really matters.  [http://thinkprogress.org/romm/2009/12/06/205058/copenhagen-two-degrees-warming-target/]

Koomey, Jonathan G. 2012. Cold Cash, Cool Climate:  Science-Based Advice for Ecological Entrepreneurs. Burlingame, CA: Analytics Press. [http://www.analyticspress.com/cccc.html]

[10] Woolsey, R. James, and Anne Korin. 2007. “Turning Oil into Salt."  National Review Online.  September 25. [http://www.nationalreview.com/content/turning-oil-salt]

My talk at Google's "How Green is the Internet?" summit last week

it was an honor to follow Al Gore on stage at Google’s “How Green is the Internet?” summit last Thursday.  I worked hard on the talk, and it’s posted (along with Gore’s talk, some “rapid fire” research talks, and a wonderfully passionate talk from Eric Schmidt, for whom I have newfound respect), at this Google site:   http://www.google.com/green/efficiency/industry-collaboration/

image

Some welcome recognition for Cold Cash, Cool Climate

Earlier this month, my book, Cold Cash, Cool Climate:  Science-based Advice for Ecological Entrepreneurs, was awarded an honorable mention in the 2013 Eric Hoffer awards, in the E-book nonfiction category.  It was also a  Finalist in the ‘Business: Entrepreneurship & Small Business’ category of the 2013 International Book Awards.

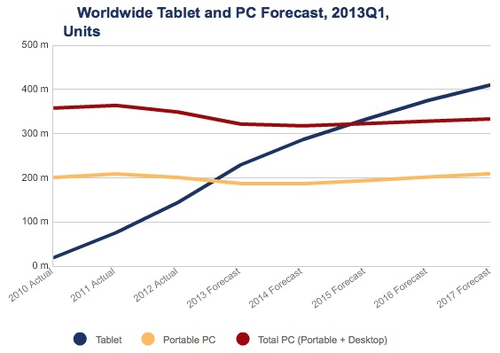
IDC predicts that shipments of tablet computers will surpass laptops in 2013

The data company IDC has a report out today suggesting that tablet shipments will surpass laptop shipments this year.  That’s not surprising to anyone who’s been following this space, and it’s an indication (if we needed any more) that the future of computing is both mobile and ultra-low power.

Here’s the key graph:

The long-term trends in the efficiency of computing that we analyzed back in 2011 continue apace!  For more on the implications of those trends, see my 2012 article in Technology Review.

Was Three Mile Island the main driver of US nuclear power's decline?

The short answer:  no.

The Bulletin of the Atomic Scientists just published a feature article by Nate Hultman and me that addresses this very question.  All the articles in that issue are available for free during the month of May 2013–after that they go behind a paywall.

Here’s the abstract of the article, to whet your appetite:

It is tempting to attribute variations in support for nuclear power to prominent accidents such as Three Mile Island in the United States or Fukushima in Japan. To illuminate how such attribution can be problematic, the authors discuss the historical context of the Three Mile Island accident in the United States. They point out that the US nuclear industry faced major challenges even before the 1979 accident: Forty percent of all US reactor cancellations between 1960 and 2010, they write, occurred before the accident in Pennsylvania. While safety concerns were undoubtedly a driver of public aversion to new nuclear construction in the United States, the nuclear industry already faced substantial economic and competitiveness obstacles, much like the nuclear industry worldwide before Fukushima.

This was a complete update and rewrite of a much longer post Nate and I did for Koomey.com that was reposted on Climate Progress.

The full reference is Hultman, Nathan E., and Jonathan G. Koomey. 2013. “Three Mile Island:  The Driver of US Nuclear Power’s Decline?"  Bulletin of the Atomic Scientists.  vol. 69, no. 3. May/June. pp. 63-70.[http://bos.sagepub.com/content/69/3/63.abstract]

An outstanding speech on climate by Al Gore at the Stephen Schneider memorial

I wasn’t able to attend Al Gore’s memorial lecture for Stephen Schneider at Stanford, but it was just posted, and it’s “must-see”.  Brilliant.  Moving.  Powerful. Inspirational.  No visuals, just a passionate and committed person speaking from his heart.

Watch it:

Al Gore @ Stanford | April 23, 2013 from Cyperus Media.com on Vimeo.

Preceding Gore’s speech is a short documentary about Steve, which captures his essential brilliance, his clarity, and his passion for truth.  Don’t miss it!

I've posted powerpoint slides with graphics from "If we don't change our direction we'll end up where we're headed"

After Climate Progress repostedIf we don’t change our direction we’ll end up where we’re headed”, many people asked for the graphics associated with that post, so I put a powerpoint deck online for easy download.  Joe Romm also posted high resolution versions of his temperature chart in Fahrenheit and Celsius here.

Please feel free to reuse these slides for any non-commercial purpose as long as you acknowledge the source and don’t alter the graphics in any significant way (OK to change slide titles, of course).  To make it all clear, I arranged a license through Creative Commons (see below).  If you want to use some or all of these graphics for a commercial purpose, please email me.

Creative Commons License


Graphics showing historical and projected GHG concentrations and global temperatures by Jonathan Koomey are licensed under a Creative Commons Attribution-NonCommercial-NoDerivs 3.0 Unported License.
Based in part (slide #2 only) on a work at http://thinkprogress.org/climate/2013/03/08/1691411/bombshell-recent-warming-is-amazing-and-atypical-and-poised-to-destroy-stable-climate-that-made-civilization-possible/.
Permissions beyond the scope of this license may be available at http://www.koomey.com

Breakthrough in small batteries!

Yesterday Nature Communications published an article summarizing a new innovation in battery technology that promises much higher power AND energy densities, even for very small batteries.  Batteries are usually good at delivering energy (kilowatt-hours) but aren’t as good at delivering power (kilowatts).  These new batteries seem to have fixed this problem, with power densities as good as the best supercapacitors with reasonable energy densities as well.

Energy storage devices are typically characterized using a Ragone Plot, which shows power density (in watts per kilogram) on the x-axis, and energy density (in watt-hours per kilogram) on the y-axis.  Figure 3 from the article shows how these new batteries stack up.

The new batteries are labeled A through H in the Figure, and they have high power densities (like super capacitors) and energy densities comparable in some cases to those of lead-acid, nickel cadmium, or nickel zinc batteries.  The article makes the case that new ways of manufacturing batteries should allow us to overcome the power density limitations in typical batteries.

For real-world applications, of course, the issue will be whether these new batteries can be manufactured at competitive costs, but the article offers the hope that new ways of structuring battery materials can lead to substantial improvements in these devices.  For those of us exploring the potential effects of widespread use of ultra-low-power electronics, that’s an exciting development.

Blog Archive
Stock1

Koomey researches, writes, and lectures about climate solutions, critical thinking skills, and the environmental effects of information technology.

Partial Client List

  • AMD
  • Dupont
  • eBay
  • Global Business Network
  • Hewlett Packard
  • IBM
  • Intel
  • Microsoft
  • Procter & Gamble
  • Rocky Mountain Institute
  • Samsung
  • Sony
  • Sun Microsystems
  • The Uptime Institute