I first wrote this book to train young analysts I was hiring when I was a Staff Scientist and Group Leader at Lawrence Berkeley National Laboratory. I found that even graduates of the best engineering schools still had a lot to learn about the art of analysis when they came to work for me. This book teaches them those skills in a readable and entertaining way, and I’ve used it to train hundreds of students and professionals since the first edition came out in 2001.
The book is composed of 39 short chapters, each covering a topic I think is important to beginning analysts. There are lots of quotations, examples, graphics, figures, and some of my favorite cartoons, so you’ll have a few chuckles as you read along. College students and advanced high school students should have no problem learning from it–the text is well edited and has been honed over the years.
For this edition, I’ve updated many examples, tightened up the text, and made sure the material related to the Internet was fully up to date.
Please email me if you have questions or comments.
Episode 52 of Chris Nelder’s Energy Transition show was posted September 20, 2017, and it features yours truly talking frankly about nuclear power economics, the role of storage, 100% renewable energy scenarios, and limits of economic models, among other things. I’m pleased to say we achieved a “geek rating” of 8.
Here’s Chris’s description of the show:
It’s the two-year anniversary of the Energy Transition Show, so we thought we’d take a break from the deep dives and just have a little fun skiing around on the surface for a change. Dr. Jonathan Koomey returns to the show for a freewheeling discussion about some of the interesting questions and debates swirling around the energy transition today, and hopefully help us glue together many of the themes that have emerged from our first 51 shows.
How do you go about an energy revolution? Is 100% renewables the right goal? How much seasonal storage will a high-renewables grid need? What will it cost? Is there a future for nuclear power? Or CCS? What should get the credit for declining U.S. emissions? How do we model the best pathways to a future of clean and sustainable energy? Can the IPCC modeling framework be fixed? What kind of carbon mitigation pathways should we be projecting? And how should we communicate the important messages on climate and energy transition? We tackle all these questions in one big omnibus episode.
The Energy Transition show is a paid subscriber podcast (so not a freebie), but if you are really interested in digging into issues about making a rapid transition to a zero emissions world, you owe it to yourself to subscribe.
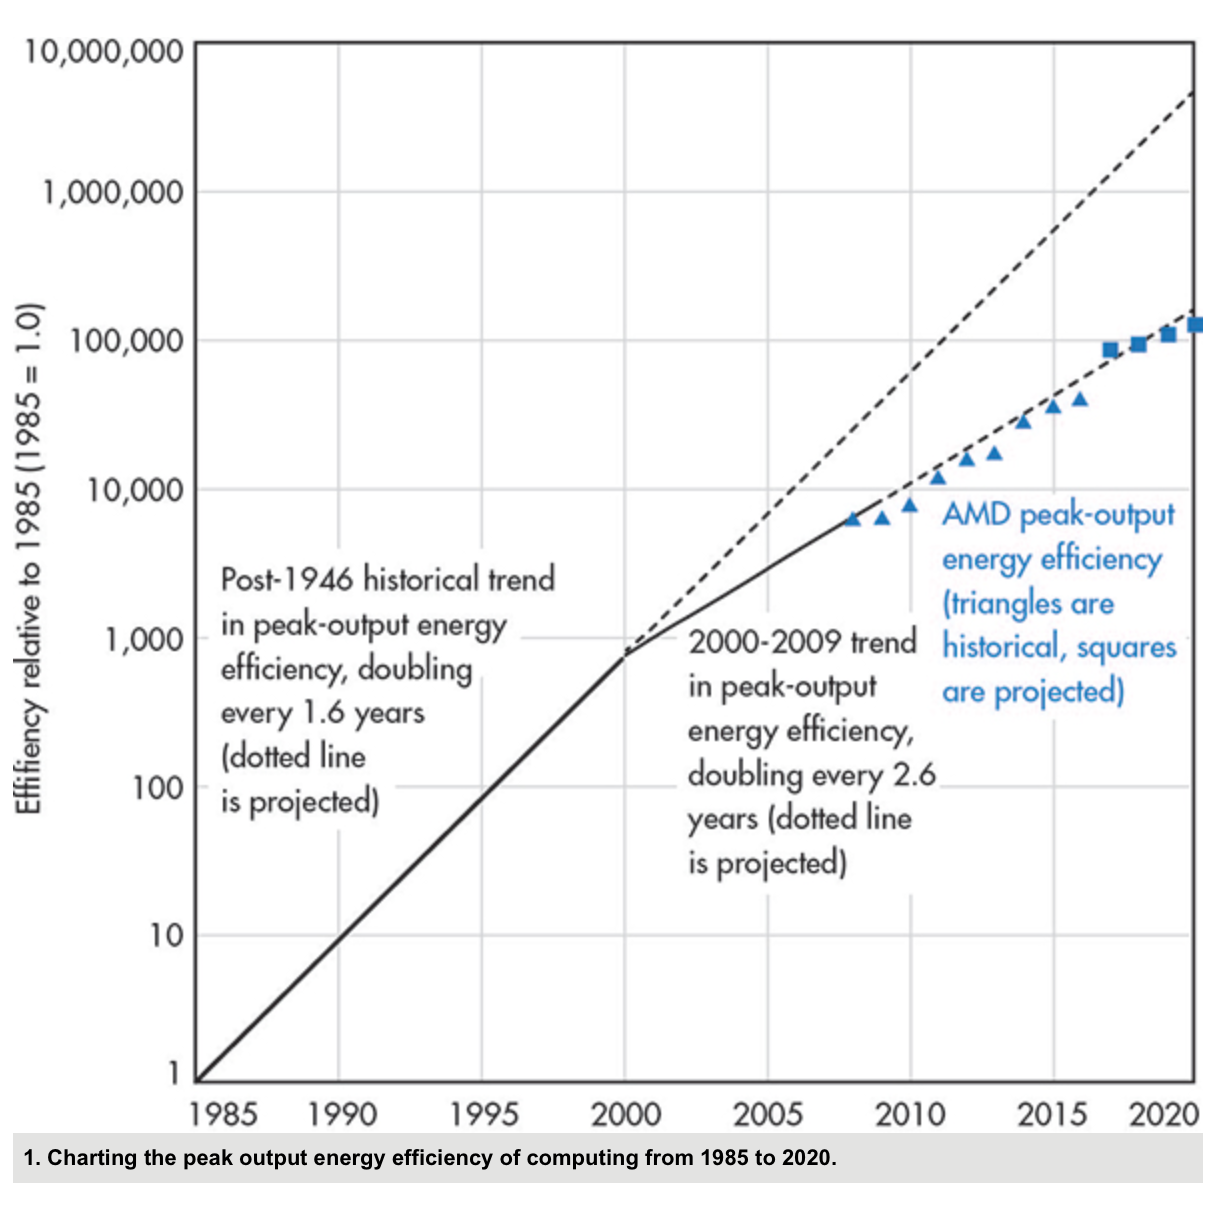
Our previous work on trends in the efficiency of computing showed that computations per kWh at peak output doubled every 1.6 years from the mid 1940s to around the year 2000, then slowed to a doubling time of 2.6 years after 2000 (Koomey et al. 2011, Koomey and Naffziger 2016). These analyses examined discrete computing devices, and showed the effect (mainly) of progress in hardware.
The slowing in growth of peak output efficiency after 2000 was the result of the end of the voltage reductions inherent in Dennard scaling, which the chip manufacturers used to keep power use down as clock rates increased (Bohr 2007, Dennard et al. 1974) until about that time. When voltages couldn’t be lowered any more, they turned to other tricks (like multiple cores) but they still couldn’t continue improving performance and efficiency at the historical rate, because of the underlying physics.
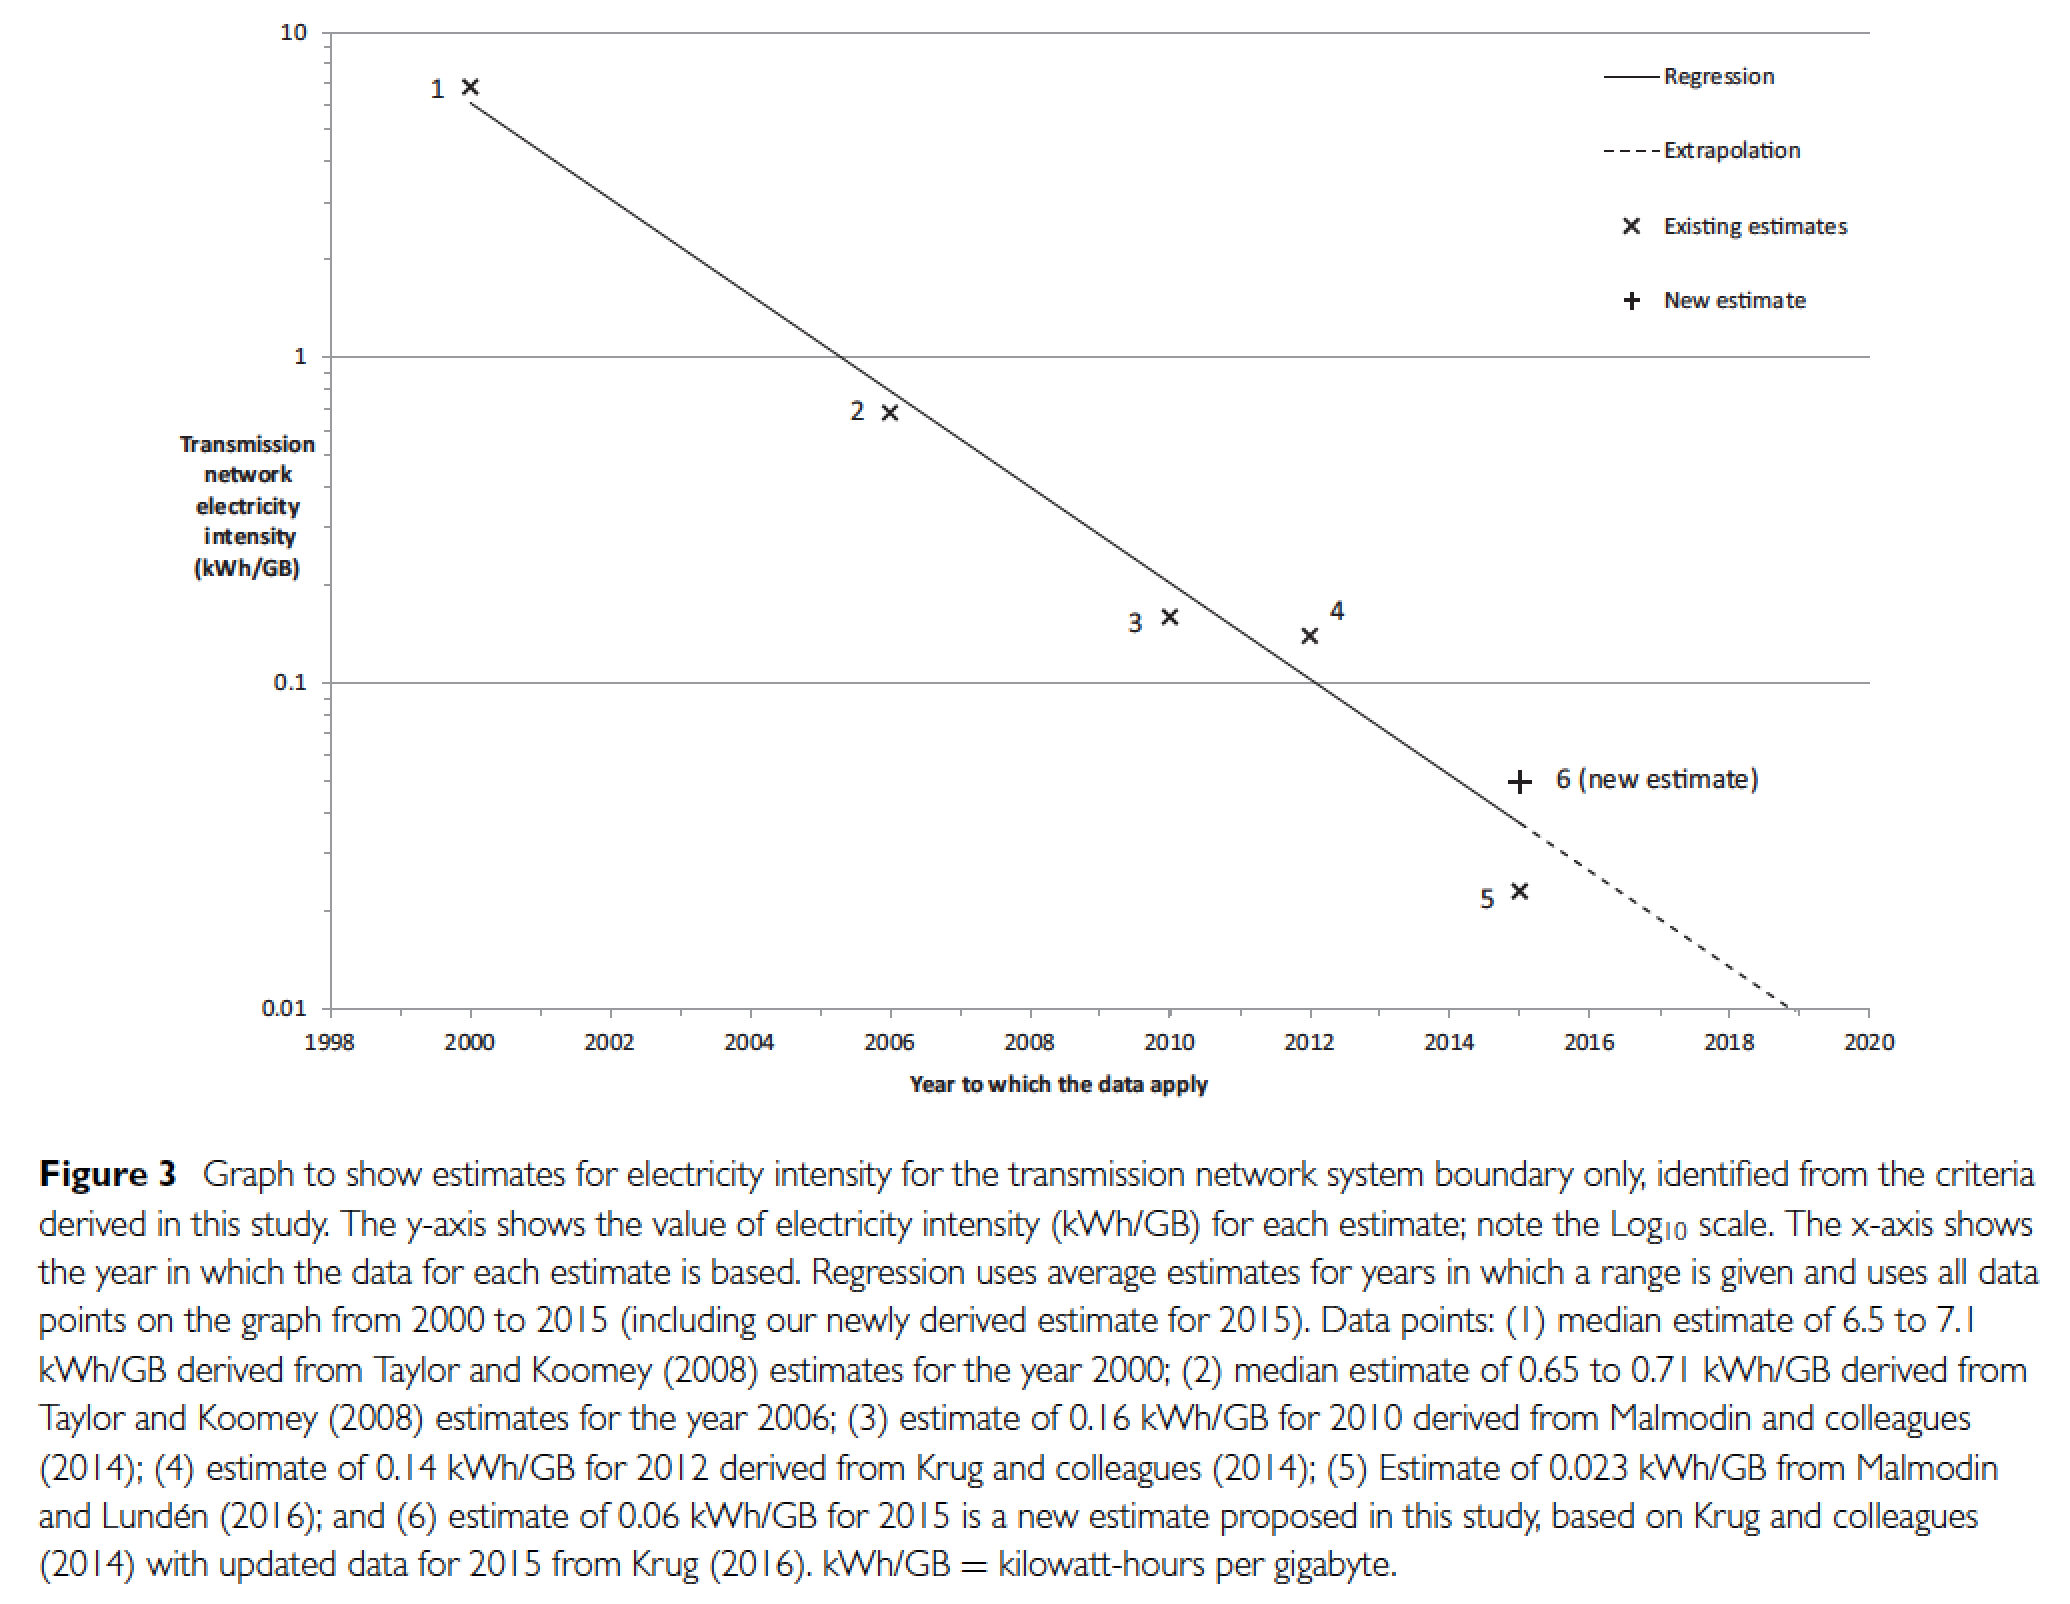
Unlike that for computing devices, the literature on the electricity intensity and efficiency of network data flows has been rife with inconsistent comparisons, unjustified assumptions, and a general lack of transparency. Our attempt to remedy these failings was just published in the Journal of Industrial Ecology in August 2017 (Aslan et al. 2017). The focus is on the electricity intensity of data transfers over the core network and the access networks (like DSL and cable).
Here’s the summary of the article:
In order to understand the electricity use of Internet services, it is important to have accurate estimates for the average electricity intensity of transmitting data through the Internet (measured as kilowatt-hours per gigabyte [kWh/GB]). This study identifies representative estimates for the average electricity intensity of fixed-line Internet transmission networks over time and suggests criteria for making accurate estimates in the future. Differences in system boundary, assumptions used, and year to which the data apply significantly affect such estimates. Surprisingly, methodology used is not a major source of error, as has been suggested in the past. This article derives criteria to identify accurate estimates over time and provides a new estimate of 0.06 kWh/GB for 2015. By retroactively applying our criteria to existing studies, we were able to determine that the electricity intensity of data transmission (core and fixed-line access networks) has decreased by half approximately every 2 years since 2000 (for developed countries), a rate of change comparable to that found in the efficiency of computing more generally.
The rate of improvement is actually faster than in computing devices, but this result shouldn’t be surprising, because the aggregate rates of improvement in data transfer speeds and total data transferred are dependent on progress in both hardware and software. Koomey and Naffziger (2016) and Koomey (2015) showed that other metrics for efficiency can improve more rapidly than peak output efficiency if the right tools are brought to bear on those problems.
Email me if you’d like a copy of the new article, or any of the others listed below.
Bohr, Mark. 2007. “A 30 Year Retrospective on Dennard’s MOSFET Scaling Paper.” IEEE SSCS Newsletter. vol. 12, no. 1. Winter. pp. 11-13.
Dennard, Robert H., Fritz H. Gaensslen, Hwa-Nien Yu, V. Leo Rideout, Ernest Bassous, and Andre R. Leblanc. 1974. “Design of Ion-Implanted MOSFET’s with Very Small Physical Dimensions.” IEEE Journal of Solid State Circuits. vol. SC-9, no. 5. October. pp. 256-268.
Koomey, Jonathan. 2015. “A primer on the energy efficiency of computing.” In Physics of Sustainable Energy III: Using Energy Efficiently and Producing it Renewably (Proceedings from a Conference Held March 8-9, 2014 in Berkeley, CA). Edited by R. H. Knapp Jr., B. G. Levi and D. M. Kammen. Melville, NY: American Institute of Physics (AIP Proceedings). pp. 82-89.
One of the most surprising things about the data center industry is how cavalier it is about the number of servers sitting around using electricity but doing nothing. We call such servers “comatose”, or more colorfully, “zombies”.
In 2015 we did our first study of this issue using granular analysis on a small data sample (4000 servers) for a six month period in 2014, using data from TSO Logic. Now we’re back with a sample four times bigger, covering six months in 2015, and with additional detail on the characteristics of virtual machines.
My colleague at Anthesis, Jon Taylor (with whom I conducted the study) wrote up a nice summary of the work here. You can also download the study at that link.
Here are a few key paragraphs:
Two years on the data set from which the original findings were drawn has grown from 4,000 physical servers to more than 16,000 physical servers and additional information on 32,000 virtual machines (VM) running on hypervisors. The new findings show improvements, as well as an alarming wake-up call.
On the upside: when an enterprise acted to remove physical zombie servers when presented with evidence of the problem’s magnitude, they were able to reduce the amount from 30 percent to eight percent in just one year. On the downside: new data show that some 30 percent of VMs are zombies, demonstrating that the same discovery, measurement, and management challenges that apply to physical servers also apply to VMs.
The study confirms that the issue is still not being adequately addressed. New data indicates that one quarter to one third of data center investments are tied up with zombie servers, both physical and virtual. Virtualization without improved measurement technologies and altered institutional practices is not a panacea. Without visibility into the scale of these wasted resources the problem will continue to challenge the data center industry.
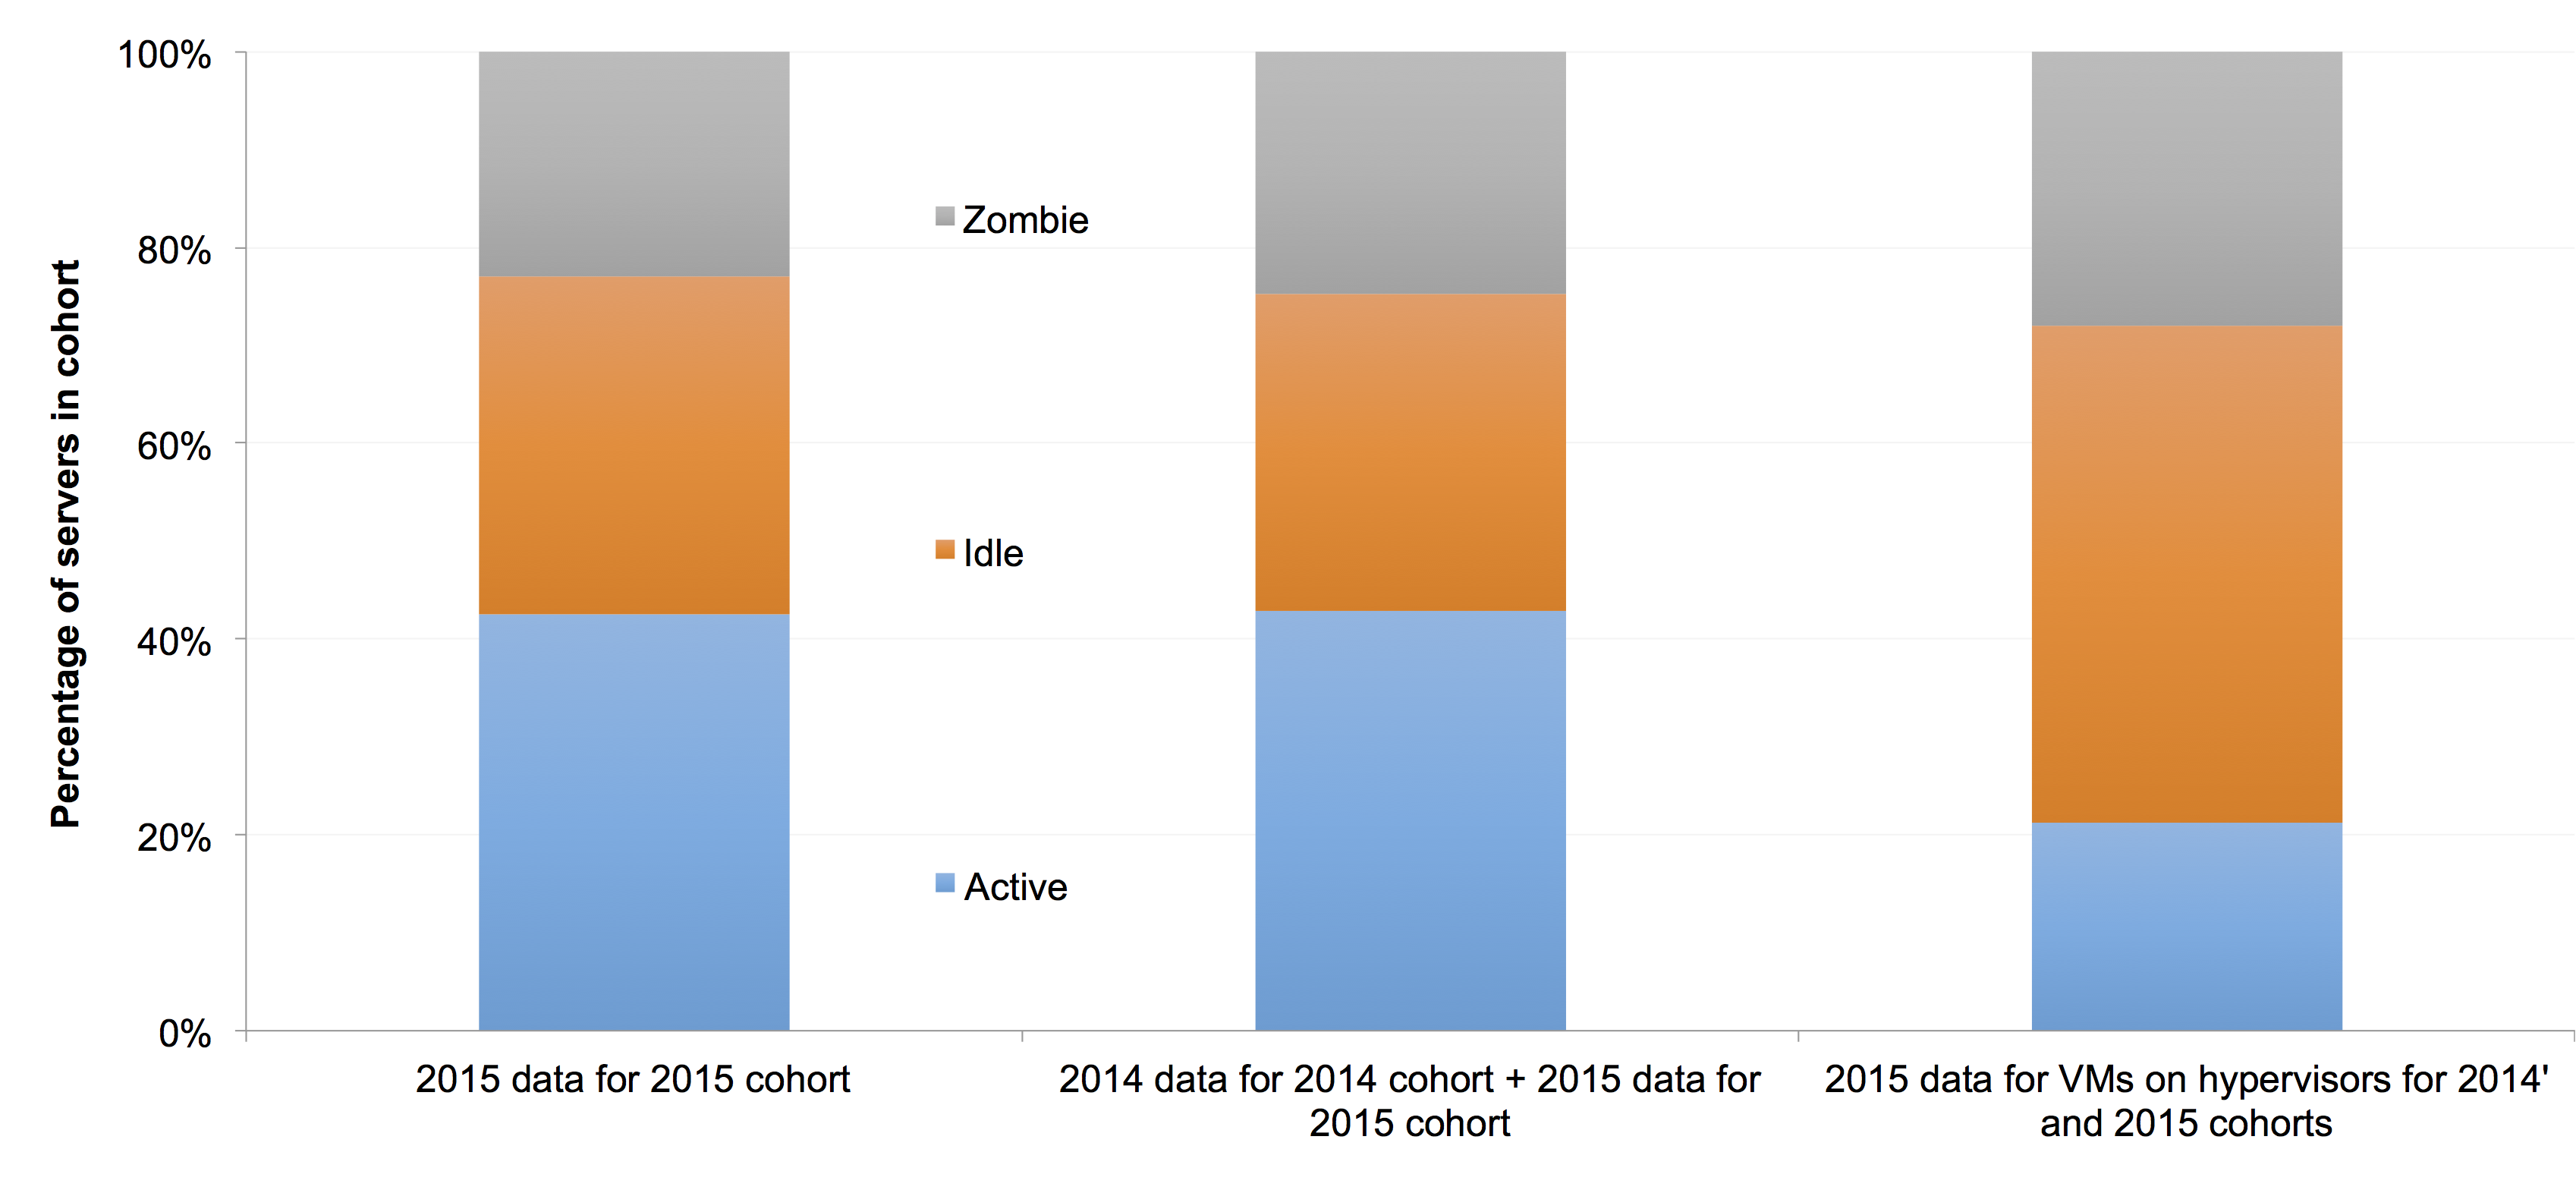
Here’s a key graph from the report:
There are some complexities in comparing the new data with the older data, because one facility in the 2014 sample decided not to allow its data to be used for the 2015 sample. The remaining facilities in the 2014 sample, when shown evidence that one third of their servers were comatose, took action and moved from more than 30% comatose to 8% comatose in just one year.
We corrected for these changes in an attempt to estimate the percent of comatose servers for enterprises that haven’t dealt with the problem, and the result is an estimate that about one quarter of servers in such companies are comatose (see the middle bar of the figure above).
Surprisingly, the percentage of virtual machines that were comatose was about 30% (see the right most bar above), indicating that the same management failures that lead to high percentages of comatose servers also afflict virtual machines. Virtualization without institutional changes is not a panacea!
One new issue raised in the latest report is important but often overlooked. Zombie servers are likely to not have been updated with the latest security patches, so they present a potent risk to the safety of the data center. Find them and remove them as soon as you can!
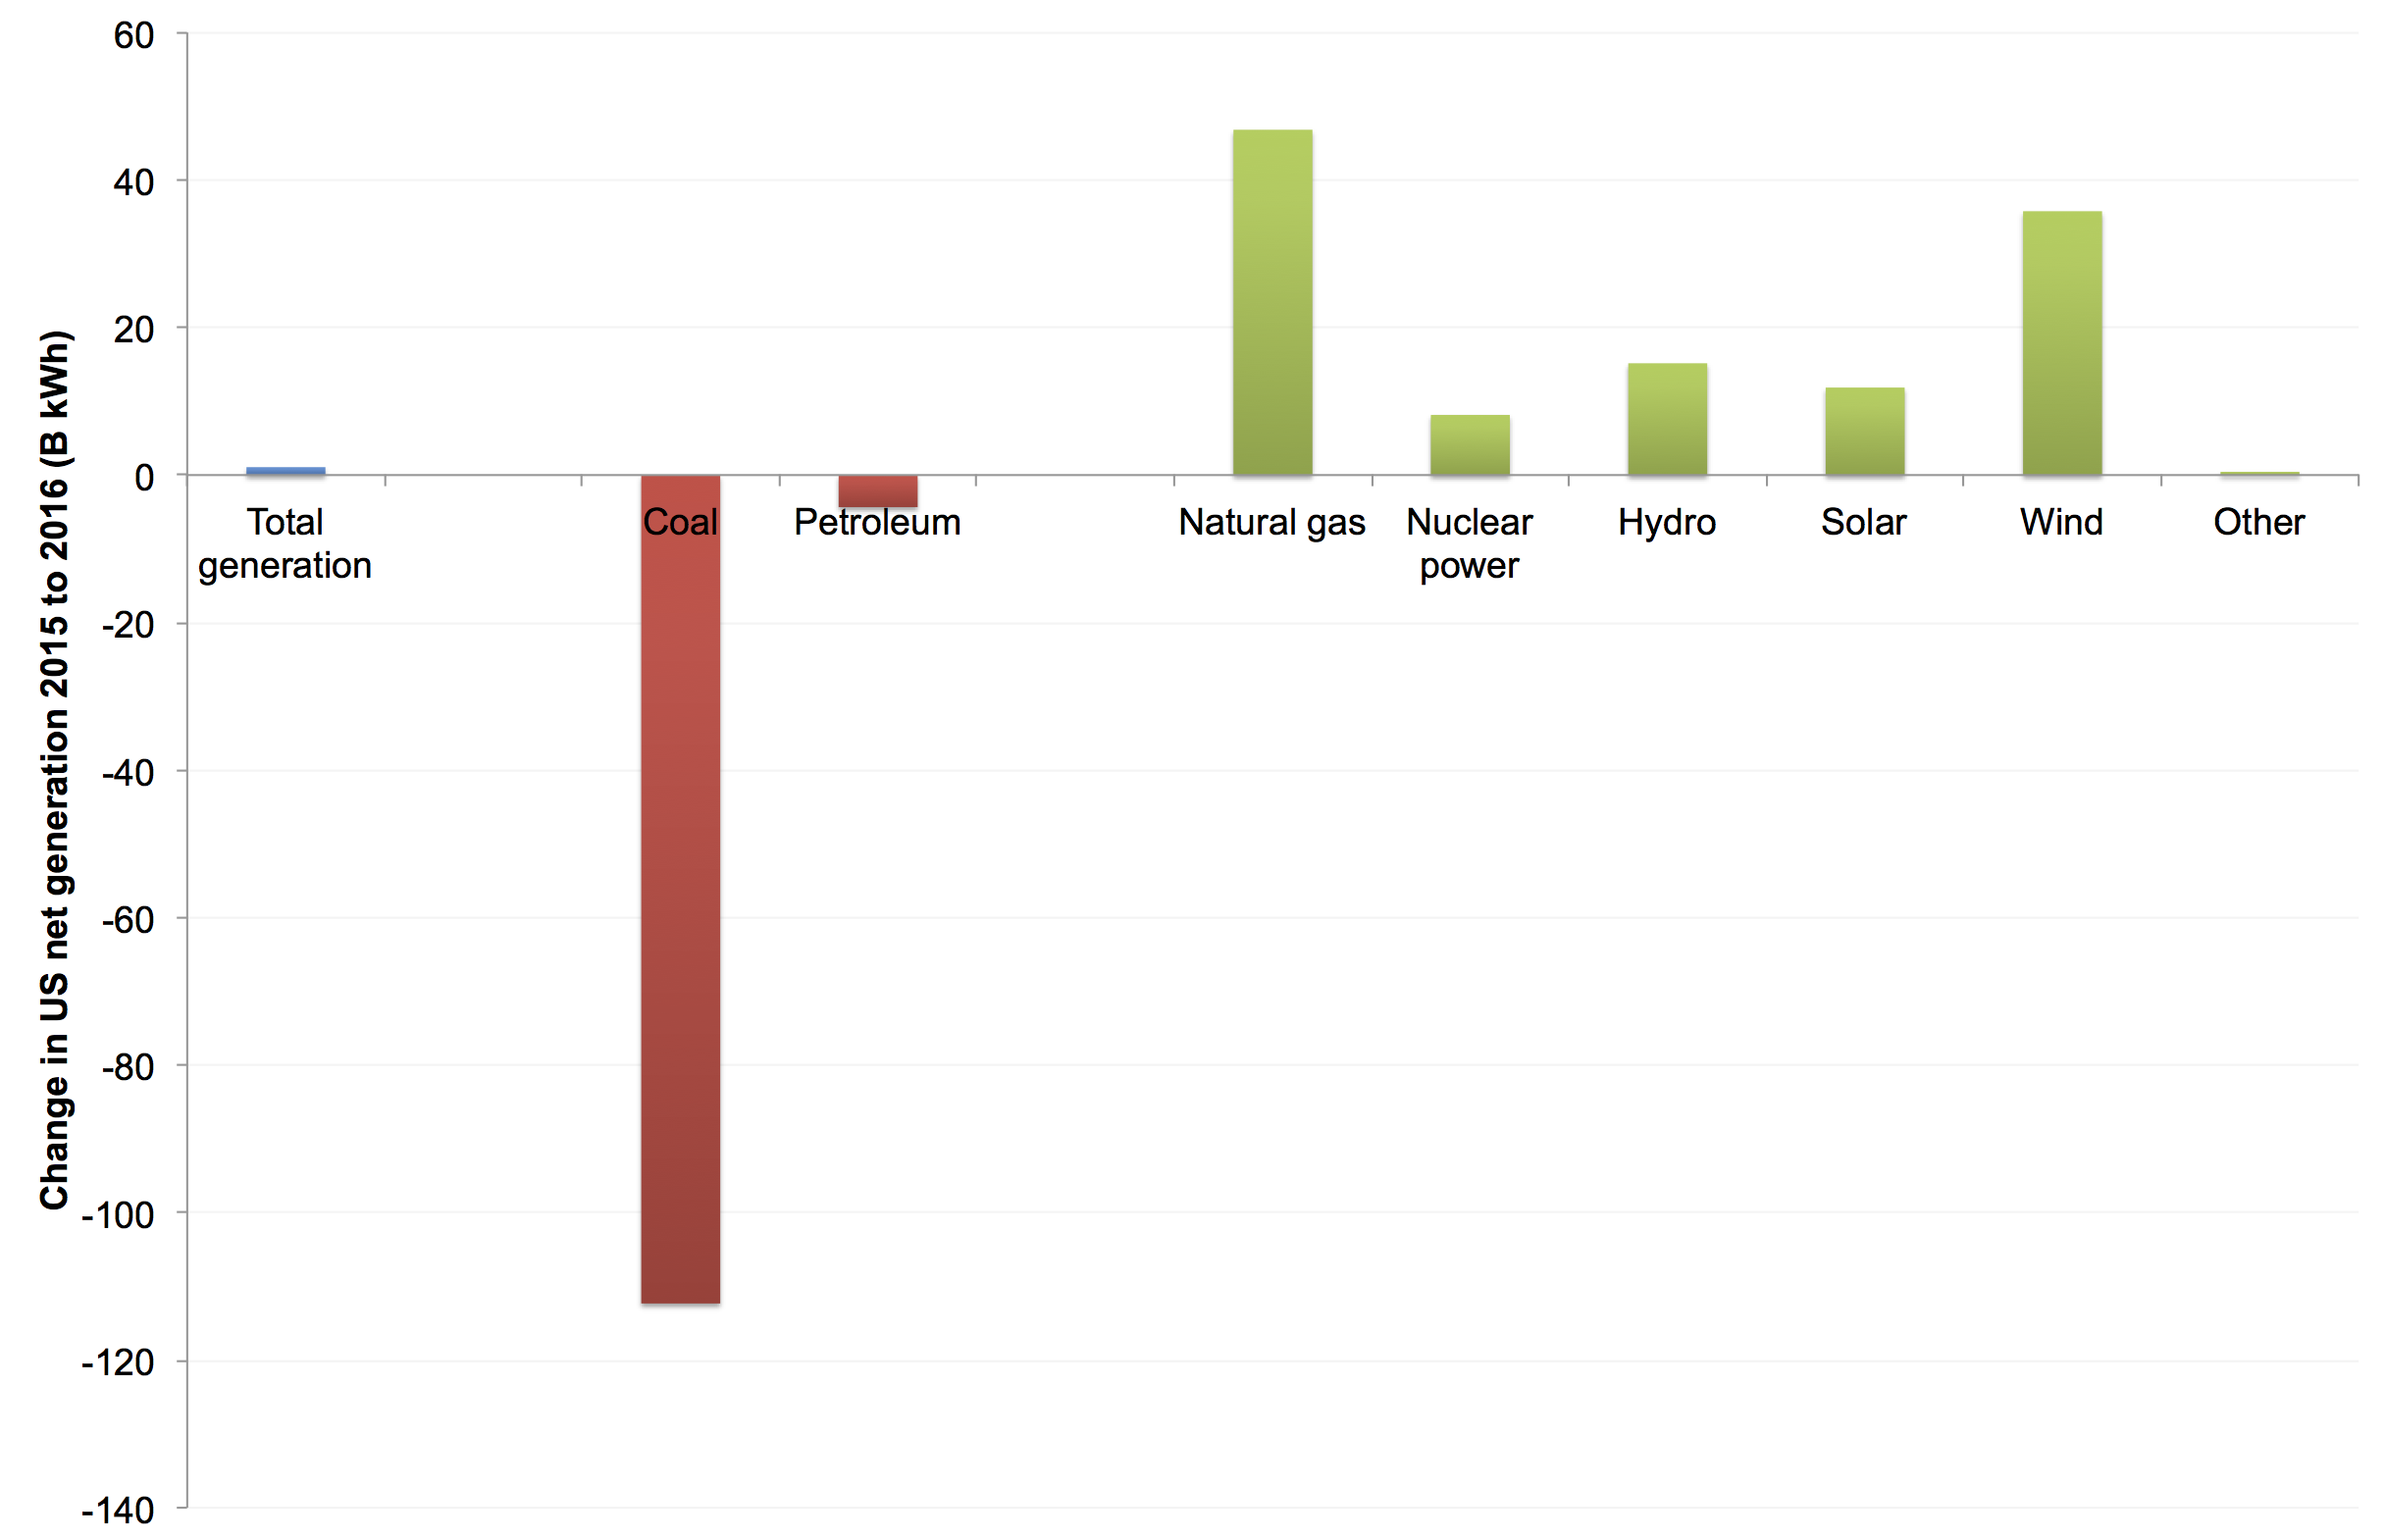
The US EIA Monthly Energy Review (Table 7.2a) includes data on net generation for the US (utilities plus independent generators), and from those data we can say something interesting about what was driving declines in coal generation from 2015 to 2016. The conventional wisdom is that cheap natural gas is the main driver of this decline, but that’s not true, at least in the 2015 to 2016 time frame.
I downloaded the data from the EIA web site, and converted the net generation numbers to billion kWh (equivalent to terawatt-hours) in my excel workbook. I then calculated the change from 2015 to 2016 and combined pumped storage hydroelectricity with conventional hydro.
The net result is shown in the following figure:
The graph shows that natural gas was responsible for offsetting about 40% of the total decline in coal and petroleum generation, but that wind plus solar displaced about the same amount. So natural gas is an important part of the story, but the other alternatives (including nuclear and hydro) are in the aggregate more important. With the recent exponential increases in installed capacity of solar and wind, they are destined to become much more important in short order.
It is not clear to me whether the growth in rooftop solar generation is included in these numbers. I know that EIA has been working to get better data on that sector, but sometimes the data gears churn slowly. If you can answer that question, please contact me!
Another important factor not accounted for here is that net generation and electricity consumption in the US has been flat since 2007 (Hirsh and Koomey 2015), which indicates decoupling between electricity demand and GDP. In the years since the mid 1990s this decoupling has been pronounced, while from 1973 to the mid 1990s electricity consumption grew in lockstep with GDP.
GDP has grown about 2%/year on average since 2010, and if we apply that 2% to net generation in 2015 we can estimate that electricity demand is about 80 B kWh lower than it would have been without that decoupling. That shift in demand (which is a function of both efficiency and structural change) is bigger than any of the other single contributors to changes in generation in the figure. For more discussion of these issues, see Hirsh and Koomey 2015.
The oil industry has known about the climate problem for a long time, which makes their resistance to actions to reduce emissions somewhat problematic (that’s an understatement). This video from Shell dated 1991 is exemplary in how it treats climate science, and it stands up really well. That speaks to just how well established climate science really is.
We knew the outlines of the climate problem in the late 1980s when we wrote the first comprehensive treatment of a 2 C warming limit (warning, 100+MB file!). The intervening decades have filled out the picture, but the basic story remains the same.
I highly recommend this 1991 video, especially for those who are skeptical about climate science. Shell lays out the case for climate action really well, although the intervening quarter century of technological progress has opened up new options for reducing emissions that could only be imagined in 1991.
The 1989 book was republished in 1992 as Krause, Florentin, Wilfred Bach, and Jonathan G. Koomey. 1992. Energy Policy in the Greenhouse. NY, NY: John Wiley and Sons.
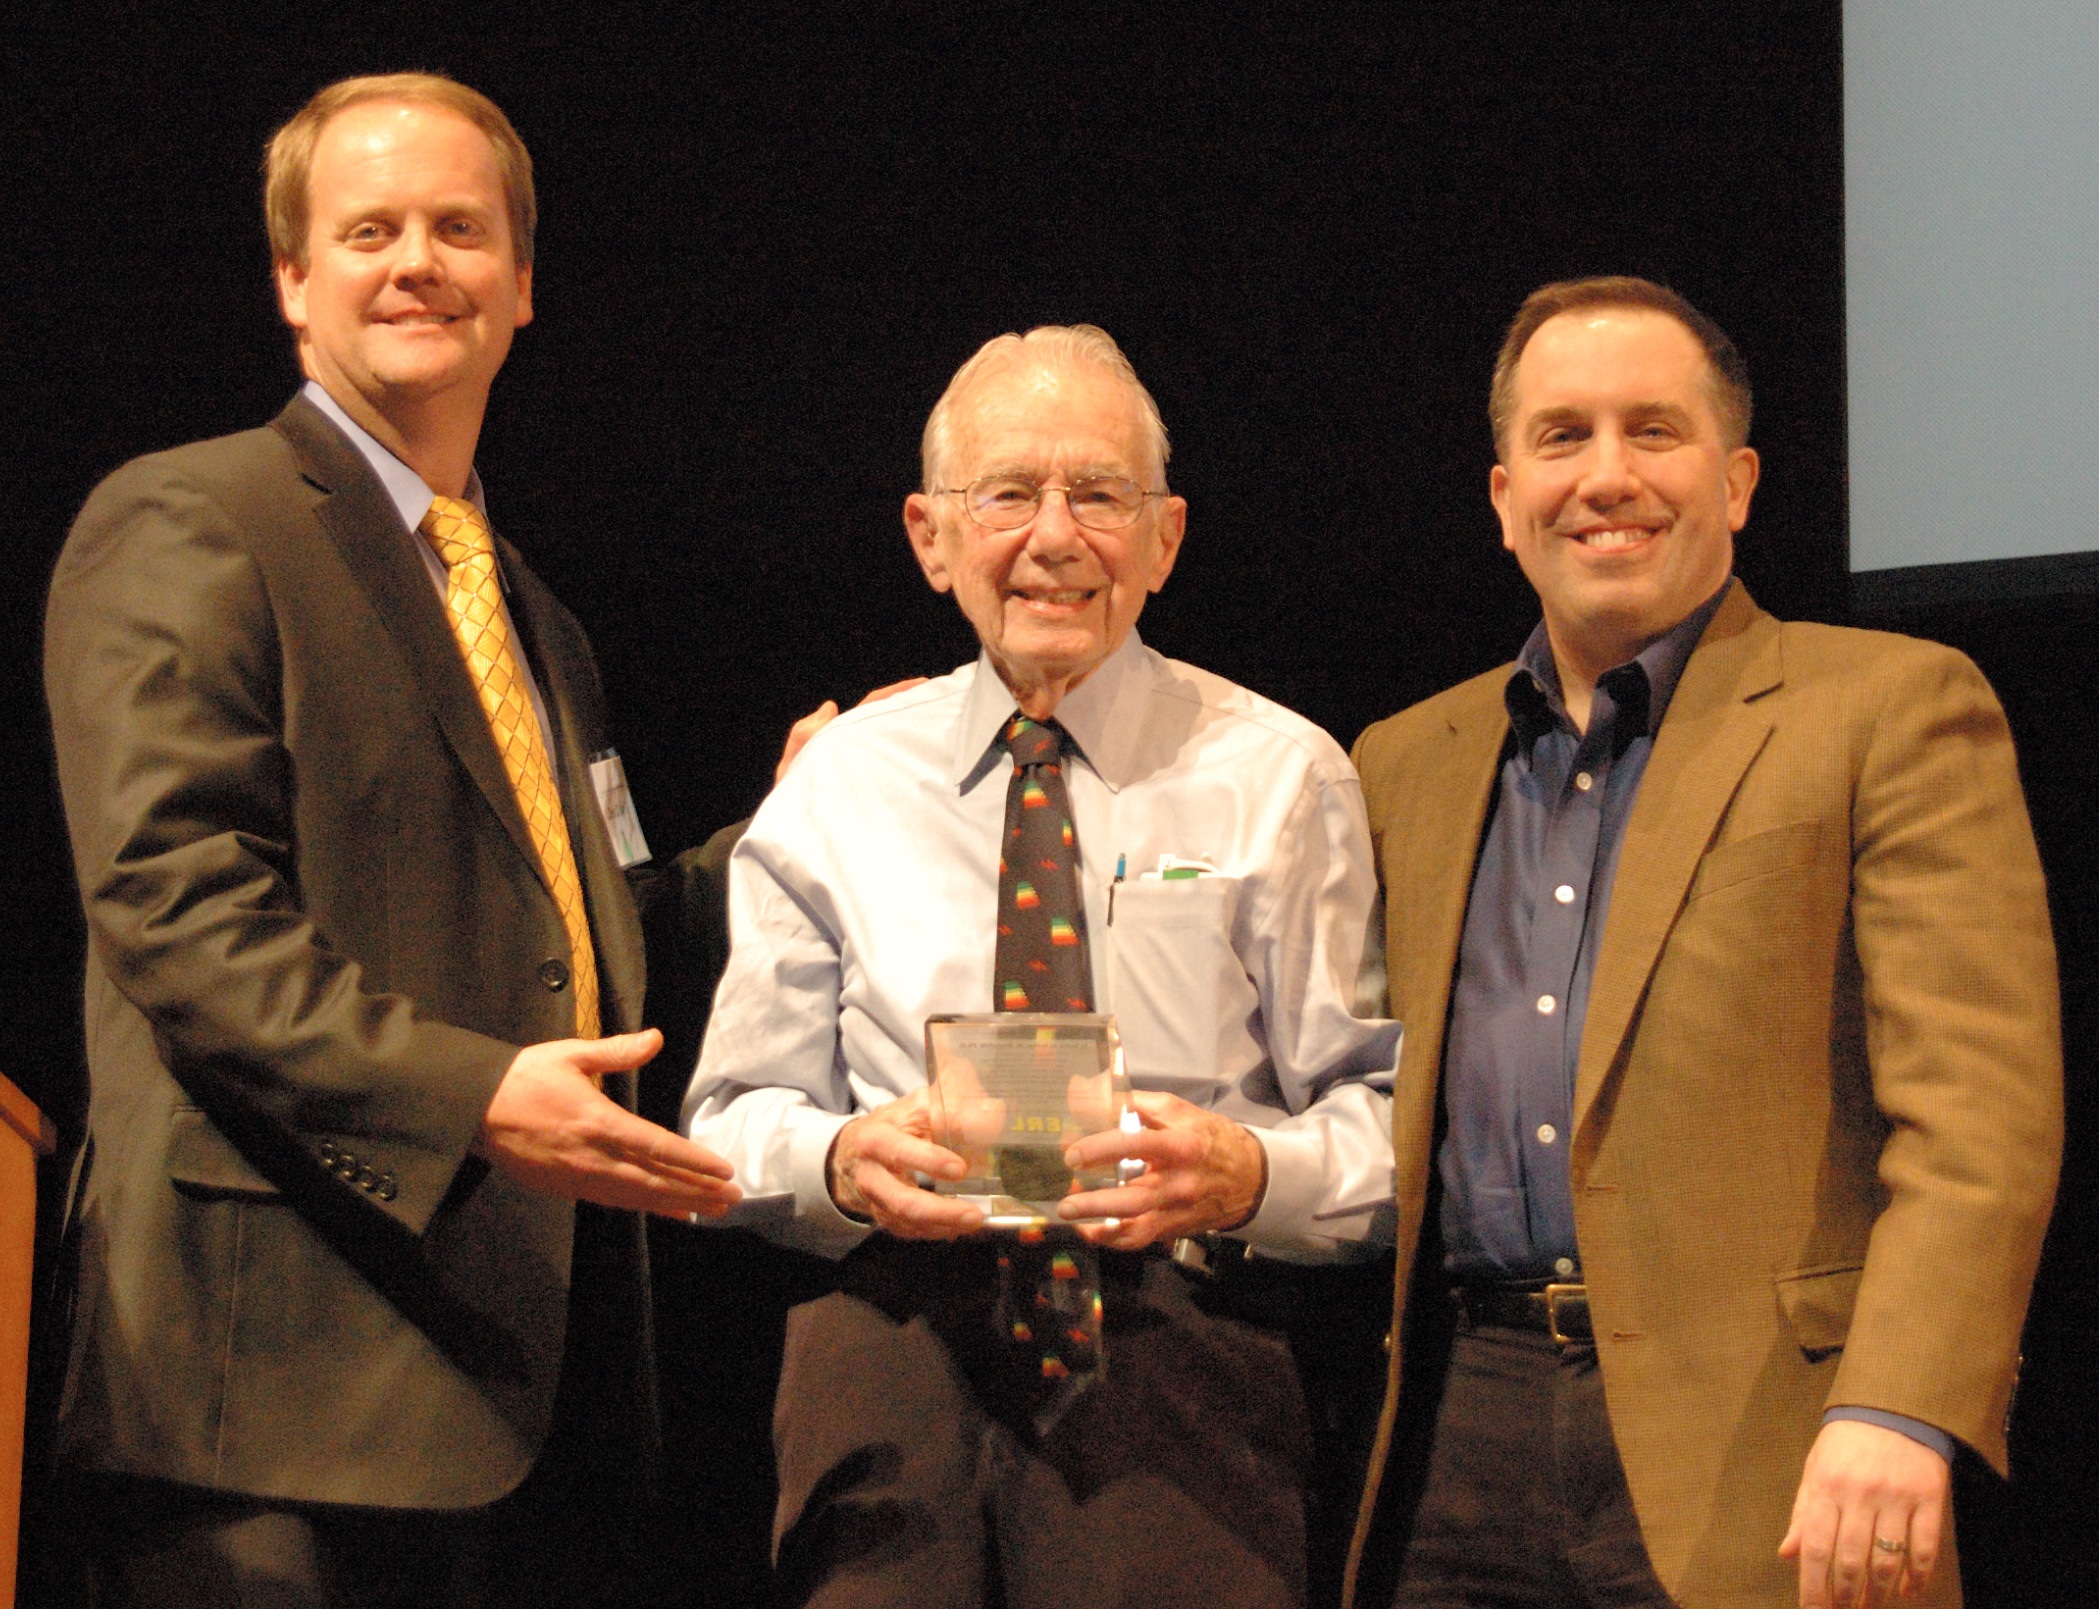
Photo: Chris Calwell (left) and Jonathan Koomey (right) in 2010 presenting Art Rosenfeld with recognition of a new unit coined in his honor, in a peer reviewed article in Environmental Research Letters. One Rosenfeld equals savings of 3 billion kWh/year (at the meter) and reductions of 3 million metric tons of carbon dioxide per year, equivalent to avoiding the need for a typical 500 MW coal plant.
Arthur Hinton Rosenfeld passed away peacefully early today, January 27, 2017. He was 90 years old.
Over the course of his career he inspired thousands of students, post-docs, and other researchers to make the world a better (and more efficient) place, and motivated policy-makers to adopt these ideas with a combination of personal charm and convincing analysis. His quick wit, enthusiasm, and unrivaled personal energy made him a beloved figure in the world of energy efficiency policy and technology.
Even when expressing controversial ideas, he did it in disarming and often whimsical way, without putting his ego in the debate. He communicated a sense of wonder and innocence, all the while recognizing the importance of getting the numbers right. He unerringly identified the right questions to ask about the right topics, and had the persistence to take research results all the way to advocacy that had real societal impact. And he did it with a friendly and collegial charm that is reflected in the fact that his students referred to him as “Art” rather than the expected “Professor Rosenfeld”.
Born in Alabama on June 22, 1926, Art spent his childhood years in Egypt, where his father was a consultant to the Egyptian sugarcane industry. He graduated with a B.S. in physics at age 18, enlisted in the Navy towards the end of the war, and afterwards enrolled in the Physics Department of the University of Chicago, where Enrico Fermi accepted him as his last graduate student.
Art married Roselyn Bernheim in 1955. They had three children, Margaret, Anne, and Art junior (Chip).
After receiving his Ph.D. in Physics in 1954, Rosenfeld joined the physics faculty at the University of California at Berkeley, where he worked in, (and from 1969 to 1974, led) the particle physics group (“Group A”) of subsequent Nobel Prize winner Luis Alvarez at Lawrence Berkeley National Laboratory (LBNL).
The oil embargo of 1973 galvanized Art; and he began asking endless questions. Why were Bay Area offices all brightly lit at 2AM when nobody was there? Why were California home-heating bills comparable to those in Minnesota? Why were utilities giving away free 200-watt electric light bulbs? And why were the then popular Eichler Homes using electric resistance heating with no roof insulation? For what activities, and in what devices, was the US consuming energy? And what where the physics-based limits for how little energy these activities really needed?
These and other questions led Art and several of his colleagues to frame the energy problem as “How to accomplish society’s goals most efficiently and cheaply” rather than “How to supply enough energy.” This reframing was revolutionary in the era that most people thought energy consumption and economic growth always increased in lockstep.
Following a yearlong “sabbatical” from particle physics, Professor Rosenfeld decided to continue working on the efficient use of energy, mainly in buildings. He eventually founded the Center for Building Science at LBNL, which he led until 1994. Art attracted a cadre of talented, creative, and energetic people to LBNL in the 1970s and early 1980s, and these leaders helped Art build a world-class center for energy and environment studies. The center also inspired a small army of students at UC Berkeley to focus on energy efficiency, and these researchers helped build the energy efficiency industry once they left the university.
Art’s contributions to the fledgling knowledge base of building science were seminal, and he is widely considered the father of energy efficiency. The Center for Building Science developed a broad range of energy efficiency technologies, including electronic ballasts for fluorescent lighting—a key component of compact fluorescent lamps (CFLs)—and a transparent coating for window glass that blocks heat from either escaping (winter) or entering (summer). He was personally responsible for developing the DOE-2 series of computer programs for building energy analysis and design that has been the gold standard for building energy analysis for more than 25 years.
Art’s work quickly took him into the policy arena. In 1975, Utilities had selected sites, and requested permits for 17 GW of power plants to come online by 1987. But long before 1987, all but 3 GW had been quietly forgotten. An even more extravagant report by Ronald Doctor of the RAND in Santa Monica had projected need for 150 GW of new power plants for California by 2000, which would put one GW of power plants every 3 miles along the coast between San Diego and San Francisco. Art worked with legislators, regulators and the then new California Energy Commission to implement much less-expensive efficiency policies that made those plants superfluous. California’s peak demand has been held to 60 GW today. So in retrospect, we have avoided at least $75 billion in wasted investment.
Art was the co-founder of the American Council for an Energy Efficiency Economy (ACEEE), and the University of California’s Institute for Energy and the Environment (CIEE). He was the author or co-author of over 400 refereed publications or book chapters.
During the Clinton administration Art served from 1994 through 1999 as Senior Advisor to the U.S. Department of Energy’s Assistant Secretary for Energy Efficiency and Renewable Energy. He also served as Commissioner at the California Energy Commission (CEC), after California Governor Gray Davis appointed him in 2000. He was reappointed in 2005 by Governor Arnold Schwarzenegger.
In 2010 he returned to LBNL and was elected to the National Academy of Engineering. In that same year he was appointed Distinguished Scientist Emeritus at LBNL. Until his death he devoted his attention to an international campaign for the adoption of white roofs and “cool colored” surfaces to reduce heat islands and mitigate global warming
His many awards and honors include the Szilard Award for Physics in the Public Interest (1986), the U.S. Department of Energy’s Carnot Award for Energy Efficiency (1993), the University of California’s Berkeley Citation (2001), the Global Energy Prize from President Medvedev of Russia (2011), the National Medal of Technology and Innovation from President Obama (2013), and the Tang Prize for Sustainable Development (2016).
When friends asked him what he does for relaxation, Art used to say “relaxing makes me nervous”. He did enjoy going jogging every weekend, particularly with his children.
Of all his prizes he was most proud of the Enrico Fermi Award in 2006, the oldest and one of the most prestigious science and technology awards given by the U.S. government and named for his mentor. Dr. Rosenfeld received the Fermi Award from Energy Secretary Samuel W. Bodman on behalf of President George W. Bush, “for a lifetime of achievement ranging from pioneering scientific discoveries in experimental nuclear and particle physics to innovations in science, technology, and public policy for energy conservation that continue to benefit humanity.” This award recognizes scientists of international stature for a lifetime of exceptional achievement in the development, use, control, or production of energy.
Professor John Holdren, director of White House Office of Science and Technology Policy under President Obama says, “Art Rosenfeld had an enormous impact on U.S. energy policy, starting in the early 1970s, with his insights and compelling quantitative analyses pointing to the potential of increased end-use efficiency as the cheapest, cleanest, surest response to the nation’s energy challenges.”
Dr. Rosenfeld is survived by daughters Dr. Margaret Rosenfeld and Dr. Anne Hansen, two granddaughters and four grandsons, as well as the entire energy efficiency community.
Acknowledgement
This article was prepared by Art Rosenfeld’s former graduate students and longtime friends and admirers, Ashok Gadgil, David B. Goldstein, and Jonathan Koomey.
Additional Information
To learn more about Art Rosenfeld’s life and career, go here.
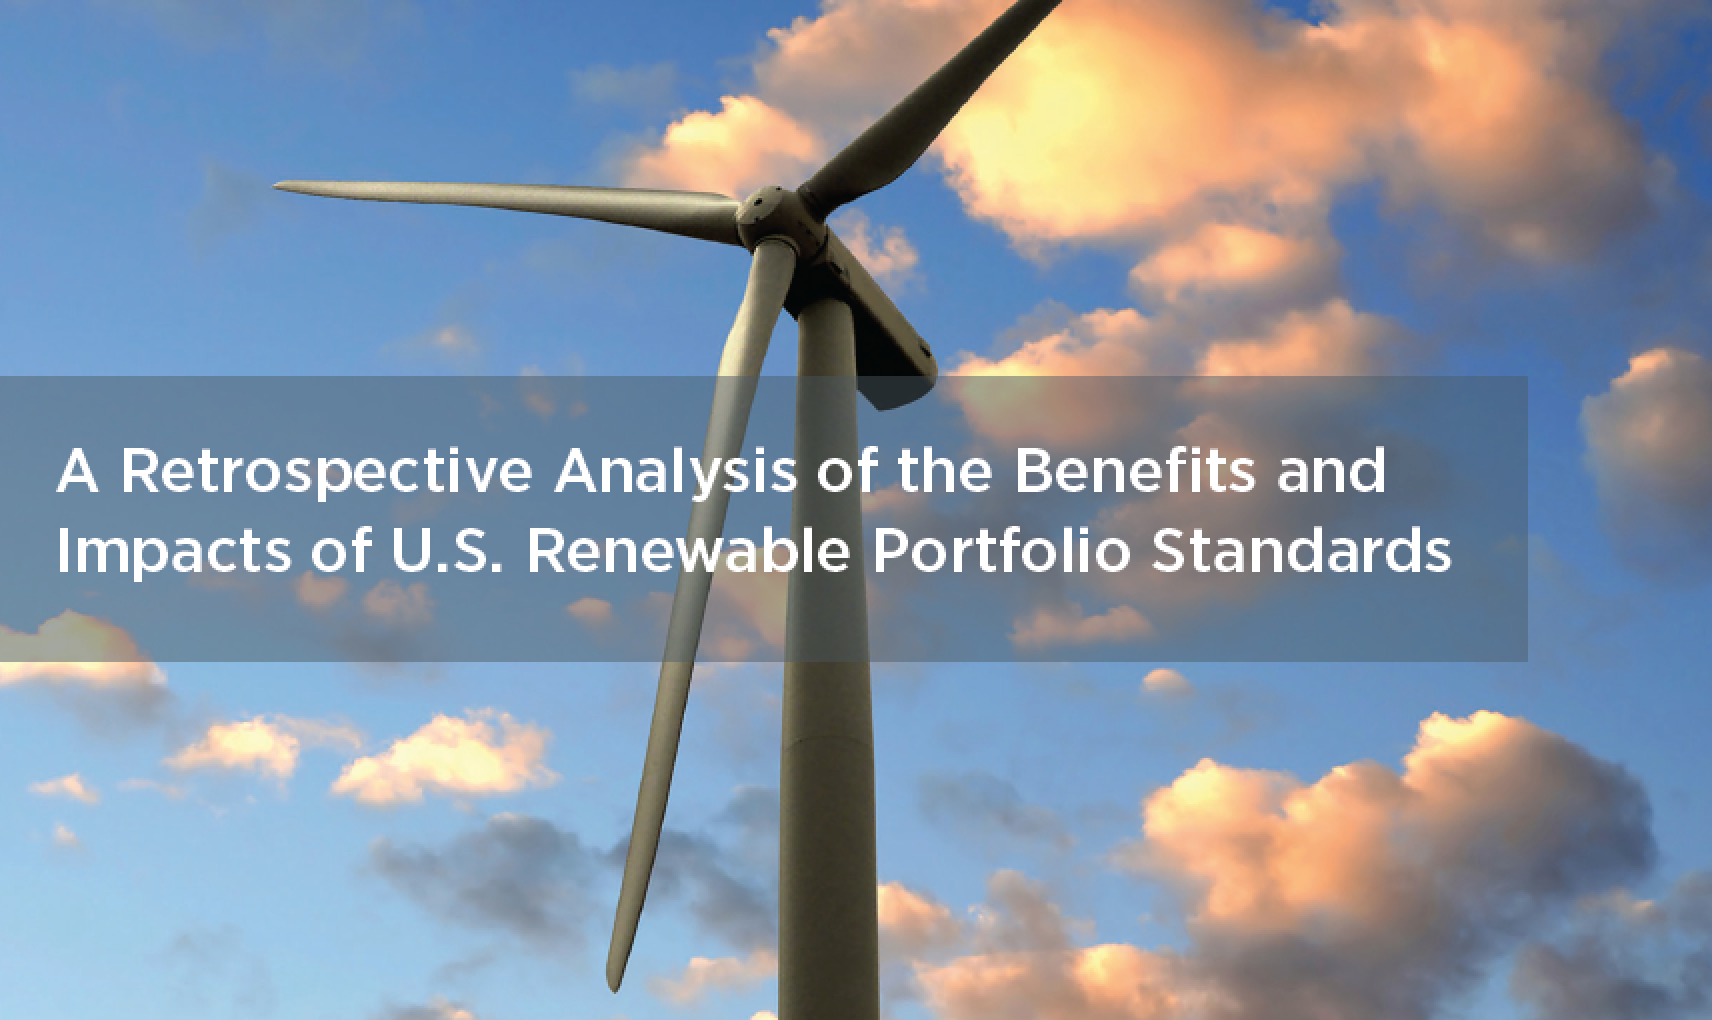
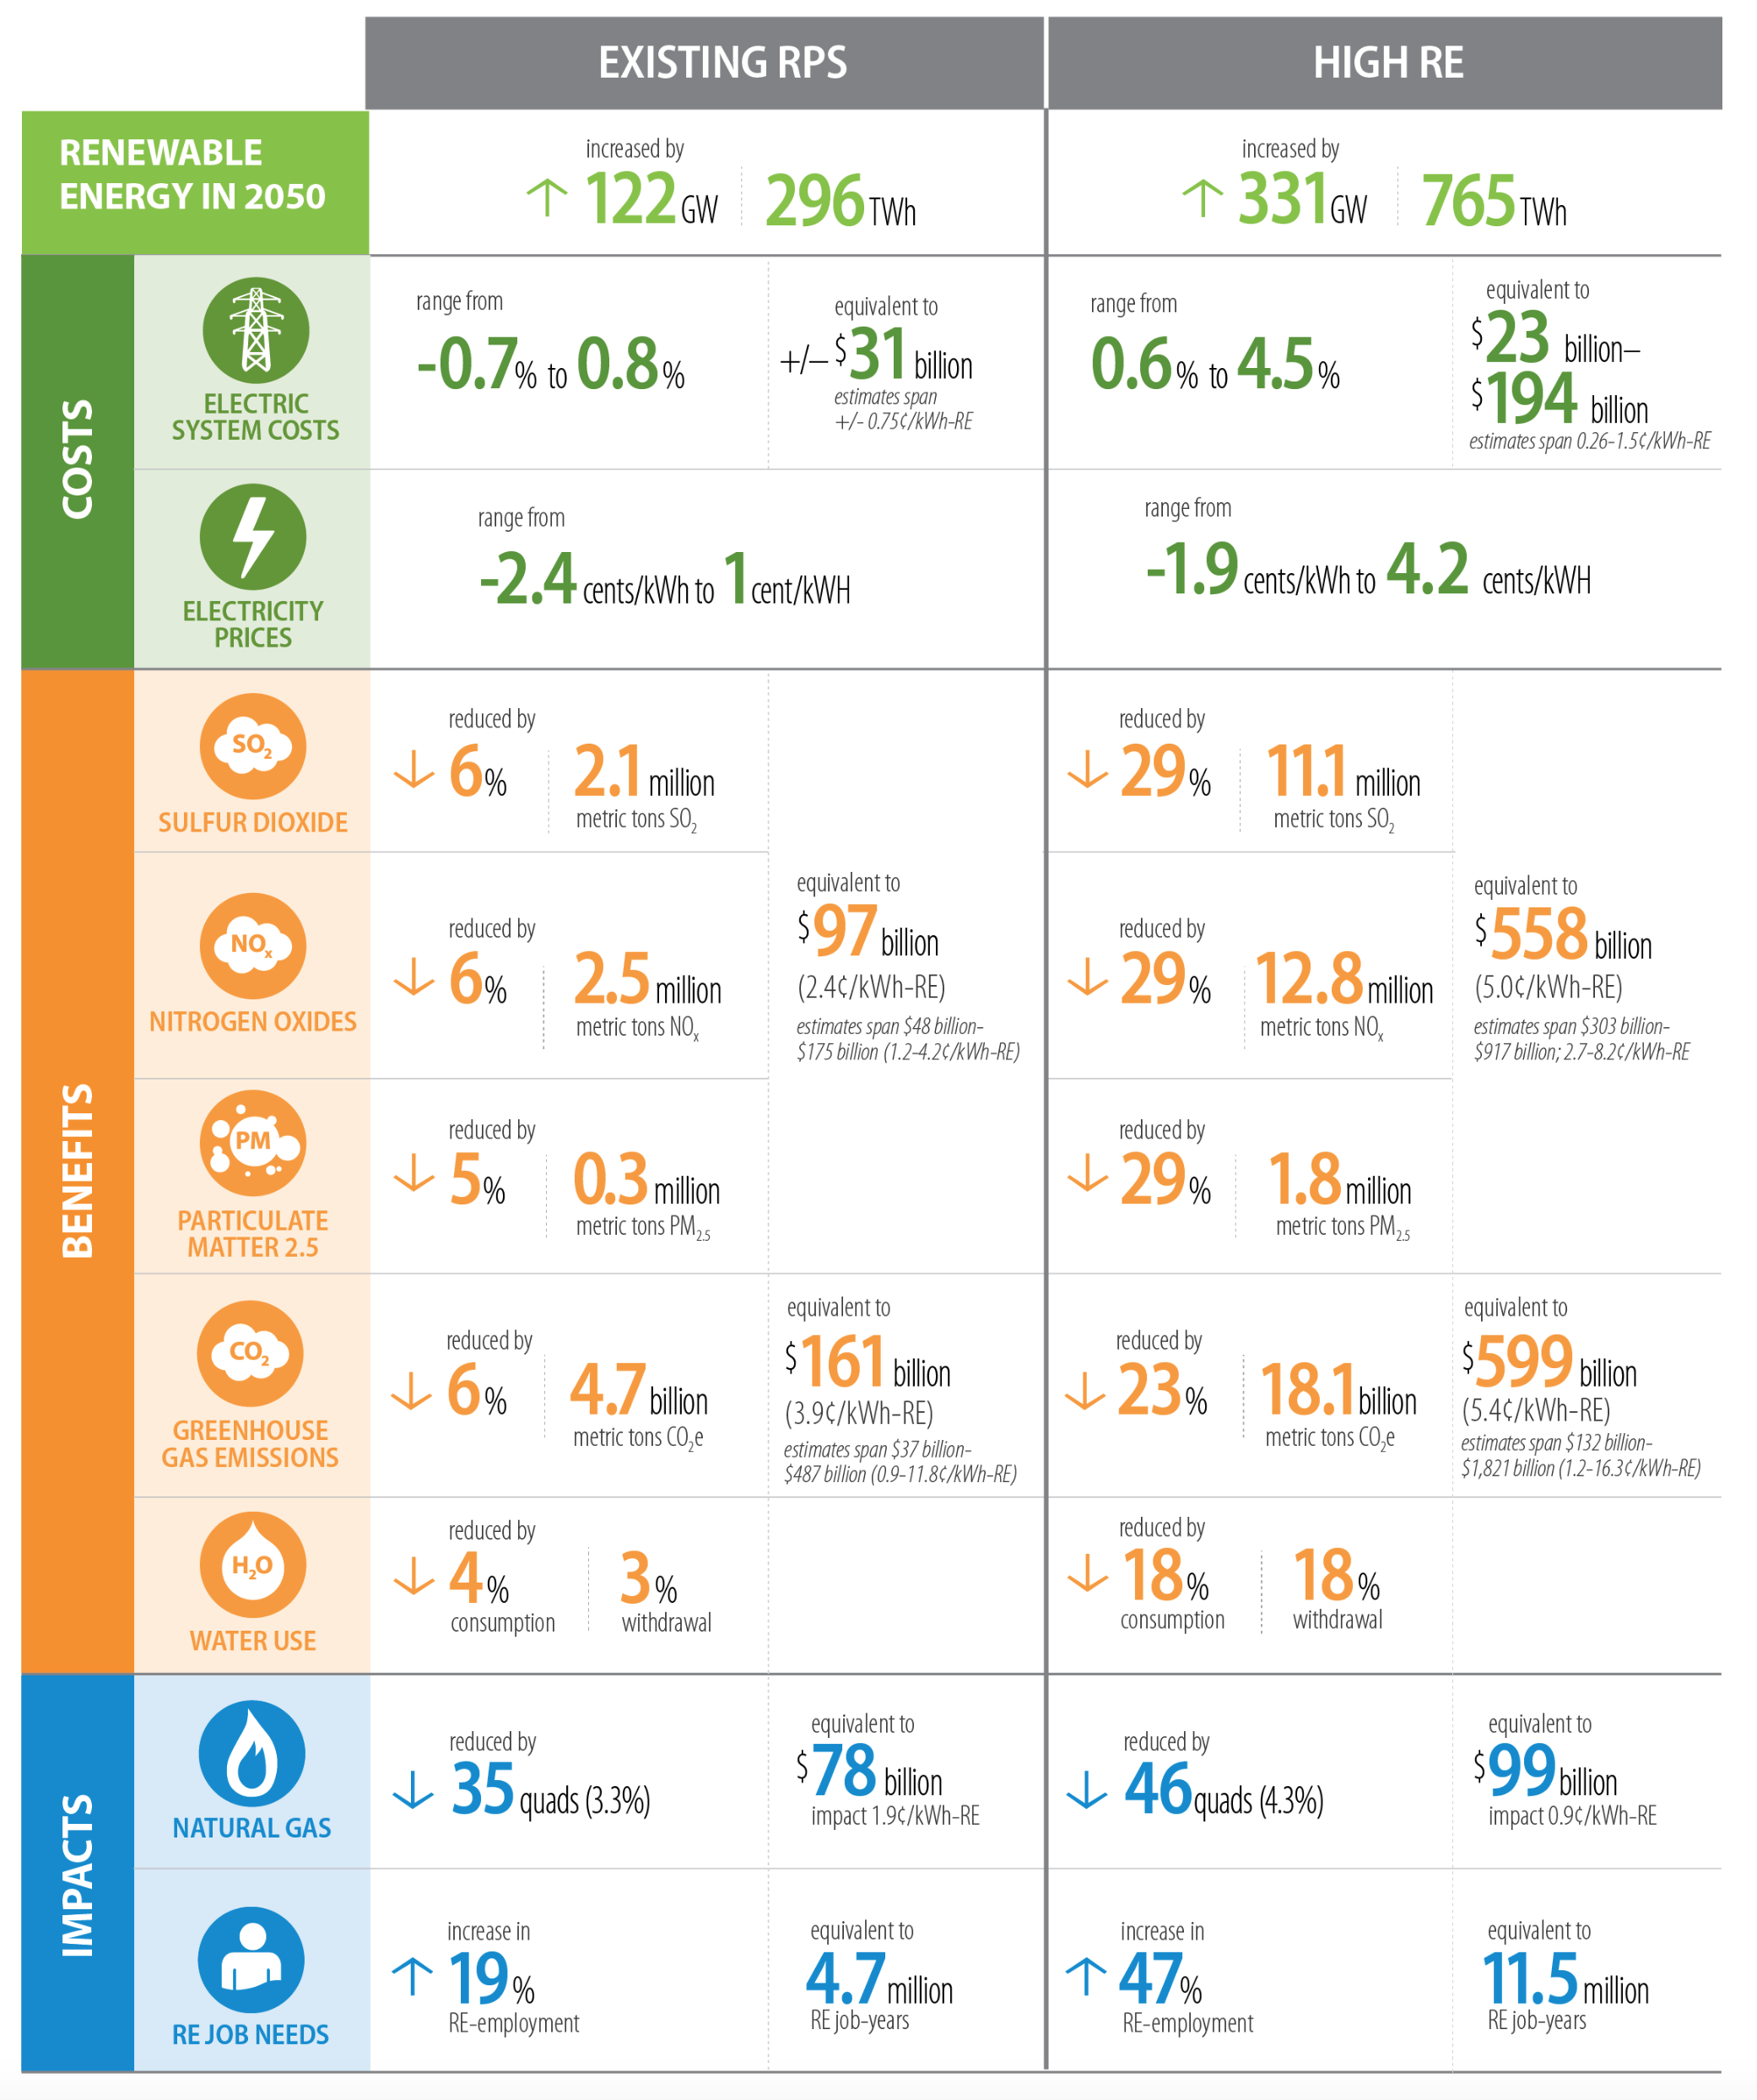
Last month, LBNL and NREL released an important study analyzing costs and benefits of renewable portfolio standards. This study is a comprehensive look not just at the costs of implementing renewable energy to meet those standards but the benefits that accrue from doing so.
Those benefits include reduced greenhouse gas emissions, reduced criteria pollutant emissions (which cause human health impacts), reduced wholesale power prices, reduced natural gas prices, reduced water use.
The figure below summarizes the benefits and costs, as well as other impacts that are not monetized.
Some key findings:
• Existing RPS policies are roughly neutral on electricity system costs, while being more likely than not to reduce electricity prices.
• Whatever costs might accrue for existing RPS policies even at the high end are offset tenfold by reduced natural gas prices, criteria pollutant emissions, and greenhouse gas emissions.
• In the high renewable energy case, costs in even the highest electric system cost case are offset more than six fold by reduced natural gas prices, criteria pollutant emissions, and greenhouse gas emissions.
Many serial disinformers (like Robert Bryce and Bjorn Lomborg) claim that renewable energy is more expensive than conventional fossil electricity generation, but as this study shows, that claim is no longer true even when just considering direct system costs for existing RPS policies.
When we include the benefits associated with reduced pollution and natural gas prices (as we should when assessing costs from the societal perspective) renewable energy is a clear winner. Society is far better off by implementing more renewable electricity generation, and with costs of utility solar, building sector solar, and wind dropping dramatically in recent years, that conclusion will only strengthen over time.
Fossil fuels are only cheap when you don’t count all the costs. When you do your sums correctly, renewables are far cheaper from society’s perspective, and in many cases cheaper in direct cost terms. Fossil fuel fired electricity generation is living on borrowed time.
In our 2014 inaugural report, “Risky Business: The Economic Risks of Climate Change in the United States,” we found that the economic risks from unmitigated climate change to American businesses and long-term investors are large and unacceptable. Subsequent scientific data and analysis have reinforced and strengthened that conclusion. As a result, we, the Co-Chairs and Risk Committee of the Risky Business Project, are united in recognizing the need to respond to the risk climate change poses to the American economy.
Now we turn to the obvious next question: how to respond to those risks. Seriously addressing climate change requires reducing greenhouse gas emissions by at least 80 percent by 2050 in the U.S. and across all major economies. We find that this goal is technically and economically achievable using commercial or near-commercial technology. Most important, we find that meeting the goal does not require an energy miracle or unprecedented spending.
The transition to a cleaner energy economy rests on three pillars: moving from fossil fuels to electricity wherever possible, generating electricity with low or zero carbon emissions, and using energy much more efficiently. This means building new sources of zero- and low-carbon energy, including wind, solar, and nuclear; electrifying vehicles, heating systems, and many other products and processes; and investing in making buildings, appliances, and manufacturing more energy efficient.
Meeting these targets requires a large-scale shift away from ongoing spending on fossil fuels and toward up-front capital investments in clean energy technologies. Many of those, such as wind and solar, have little or no fuel cost once built. Given an appropriate policy framework, we expect these investments to be made largely by the private sector and consumers, and to yield significant returns. Because of the large capital investments and the long-term savings in fuel costs, this shift presents significant opportunities for many American investors and businesses. Notably, shifting the U.S. to a low-carbon, clean energy system presents not just long term benefits but also immediate, near-term opportunities, particularly for those actors best positioned to capitalize on these trends.
Since I started analyzing greenhouse gas mitigation options in the late 1980s, the default assumption has been to use the business-as-usual trends for consumption by fuel and not change them much as we searched for emissions reductions options. What has always been true is that the options for reducing emissions in the electricity sector have been cheaper and more plentiful than those for industry or transportation, and that continues to be true.
The Deep Decarbonization analysis from E3 (which is the analysis framework on which we built From Risk to Return) was one of the first to show that the ease of reducing emissions from the electricity sector created an opportunity. If society engages in large scale electrification of most end-uses in the economy at the same time as we improve efficiency and decarbonize the electric grid, much larger emissions reductions become possible. And that’s the framework that led to the findings of today’s report.
My colleague Sam Naffziger (AMD) and I just published our latest article titled “Energy efficiency of computing: What’s next?” in the magazine Electronic Design. Here’s the abstract, which didn’t make it into the actual online article:
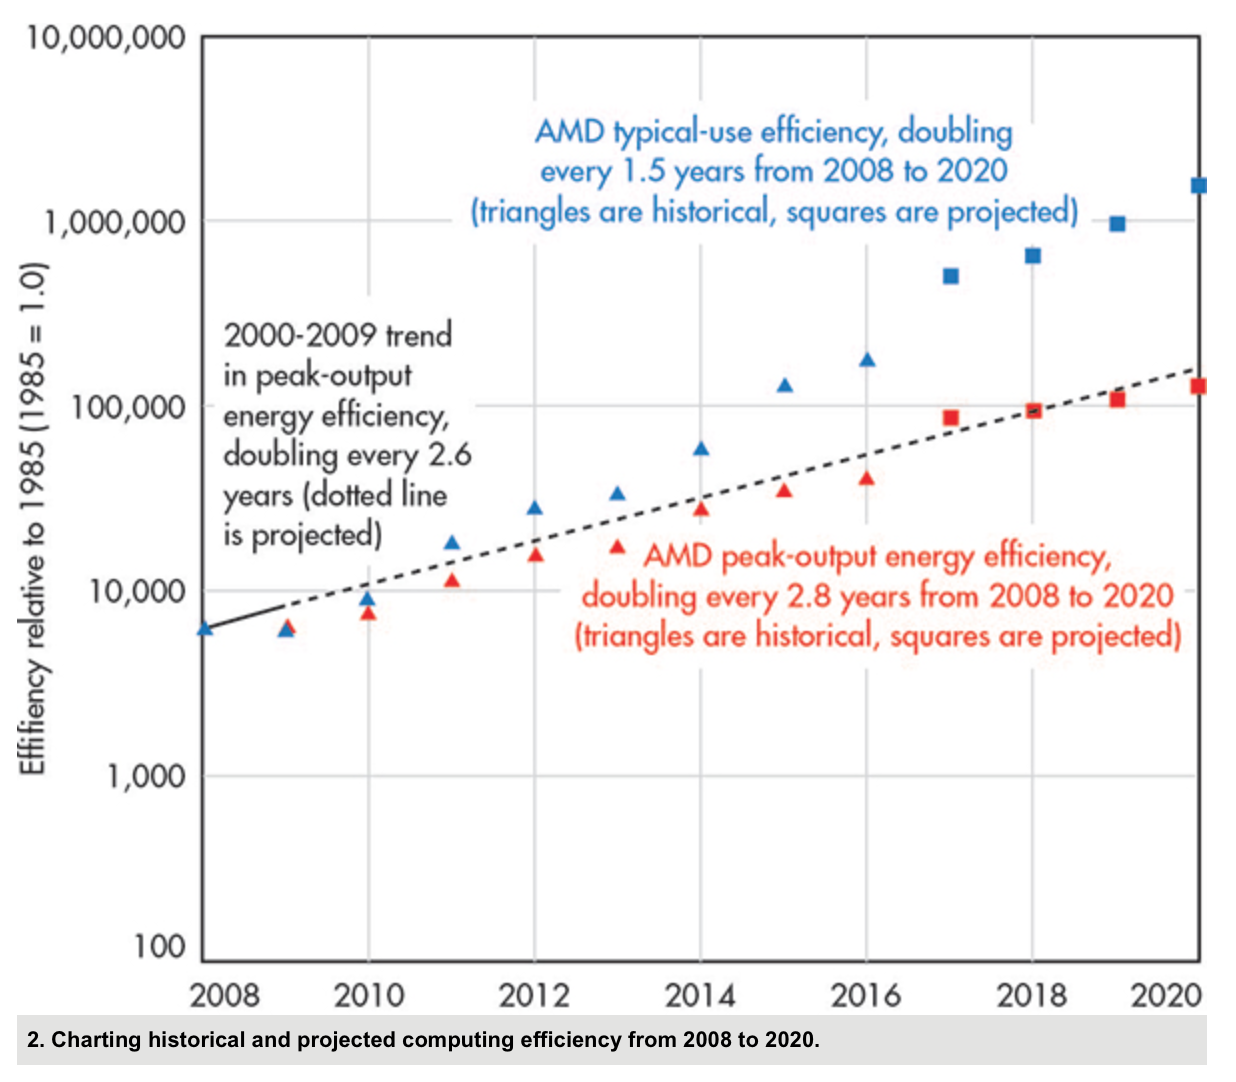
Today’s computing systems operate at peak output a tiny fraction of the year, so peak output energy efficiency (which has slowed since the turn of the millennium) is not the most relevant efficiency metric for such devices. The more important question is whether computing efficiency in idle and standby modes (which are more representative of “typical use”) can be improved more rapidly than can peak output efficiency. This article demonstrates that in the past eight years, the answer to that question has been a resounding yes, and we expect those more rapid efficiency improvements for computers in typical use to continue for at least the next few years.
Our original work (2011) on efficiency trends showed the energy efficiency of computing had doubled every 1.6 years since the beginning of the computer age:
In that work, I didn’t examine the post-2000 period in detail. When I re-analyzed the 2011 data, I found that peak output efficiency had slowed after 2000, with a doubling time of 2.6 years. That result makes sense, because Dennard scaling ended in 2000 or so. Figure 1 in our new article shows the effect of that change.
When AMD approached me with new data, I leapt at the chance to see what trends were implied in those data. As Figure 1 shows, their trend in peak output efficiency from 2008 to 2016 lies almost exactly on the trend I found in our 2011 data.
The key insight of the new article is that there are different measures of efficiency, and that a focus on peak output efficiency is not as appropriate for many types of computing devices (whose energy use is dominated by long periods of idle, standby, and sleep). We show that a focus on what we call “typical use” efficiency reveals more rapid improvements than are evident in peak-output efficiency in the 2008 to 2016 period, as shown in Figure 2.
This new article is an expanded look at the data we first put forth in IEEE Spectrum last year:
If you’d like a copy of the original 2011 article or the Electronic Design article with the related appendices, please email me. The full reference is:
The sterling reputations of Michael E. Mann and Tom Toles precede them, and in The Madhouse Effectthey do not disappoint. I confess that I read all the cartoons first (I’m a big Tom Toles fan). Then I dug in to the text, and found it equally enjoyable.
The writing is brilliantly clear and concise. The science is unfailingly accurate. And the cartoons add an immediacy, accessibility, and passion to the book that “normal” books about the climate problem usually lack.
Chapter 1 is critically important to understanding what I see as the key purpose of this book. The campaign of denial and deceit against climate science is an attack on rational thinking and scientific inquiry more generally, and this book is a counterattack against that effort for a non-technical audience.
Others have made this case, notably Naomi Oreskes in Merchants of Doubt, and Mann and Toles echo and support Oreskes’ arguments, with additional context and color from Professor Mann’s experience as a practicing climate scientist who has faced down the deniers on more than one occasion (even prevailing in court).
Mann and Toles also don’t shrink from naming names, and this is one of the most important contributions of the work, particularly for practicing journalists. The rogue’s gallery of deniers and delayers is a who’s who of people who journalists shouldn’t cite on this topic (or probably any topic). Their credibility is shot in the scientific community, and they should be treated as the cranks and crackpots that they are.
The supporters of the deniers follow a particular strategy, one that was well honed by the corporate responses to various public health and environmental issues, as documented by Naomi Oreskes and others. They make excuses that parallel the high level talking points summarized at Skeptical Science:
It’s not a problem.
If it is a problem, we didn’t cause it.
Even if we caused it, fixing the problem would be too expensive and cost too many jobs.
These are exactly the same points industries used in fighting government action on cigarettes, asbestos, seat belts, air bags, lead in paint and gasoline, catalytic converters, ozone depletion, acid rain, and any number of other related issues, and we need to start treating it as a deliberate strategy instead of just a legitimate line of argument to be analyzed and assessed in isolation. That doesn’t mean industry will never raise real issues about whether and how to regulate a particular environmental problem, just that we should be more than a little skeptical whenever we hear this self-serving way of framing issues. It is especially important for members of the news media to understand this tactic, because they often unwittingly serve as megaphones for industry arguments of this form. If they realized that this strategy is a deliberate one, they might be a bit more careful in how they characterize these stories.
Those of us who’ve been studying climate science and solutions for decades have grown weary of the deniers being treated as serious contributors to the debate. This book makes a strong case for voting them off the island.
The only minor criticism I’d raise of The Madhouse Effect is that the treatment of the economic case for rapid climate mitigation is a bit less strong than I’d prefer, but Professor Mann isn’t an economist or a technologist, so this isn’t really surprising. Perhaps for his next popular treatment he’ll bring in a collaborator to take a more detailed crack at that aspect of the problem!
This is just a quibble, however. It is rare to find a book on a complex topic that is so clearly written, compelling, and (dare I say it?) fun. I loved it, and you will, too.
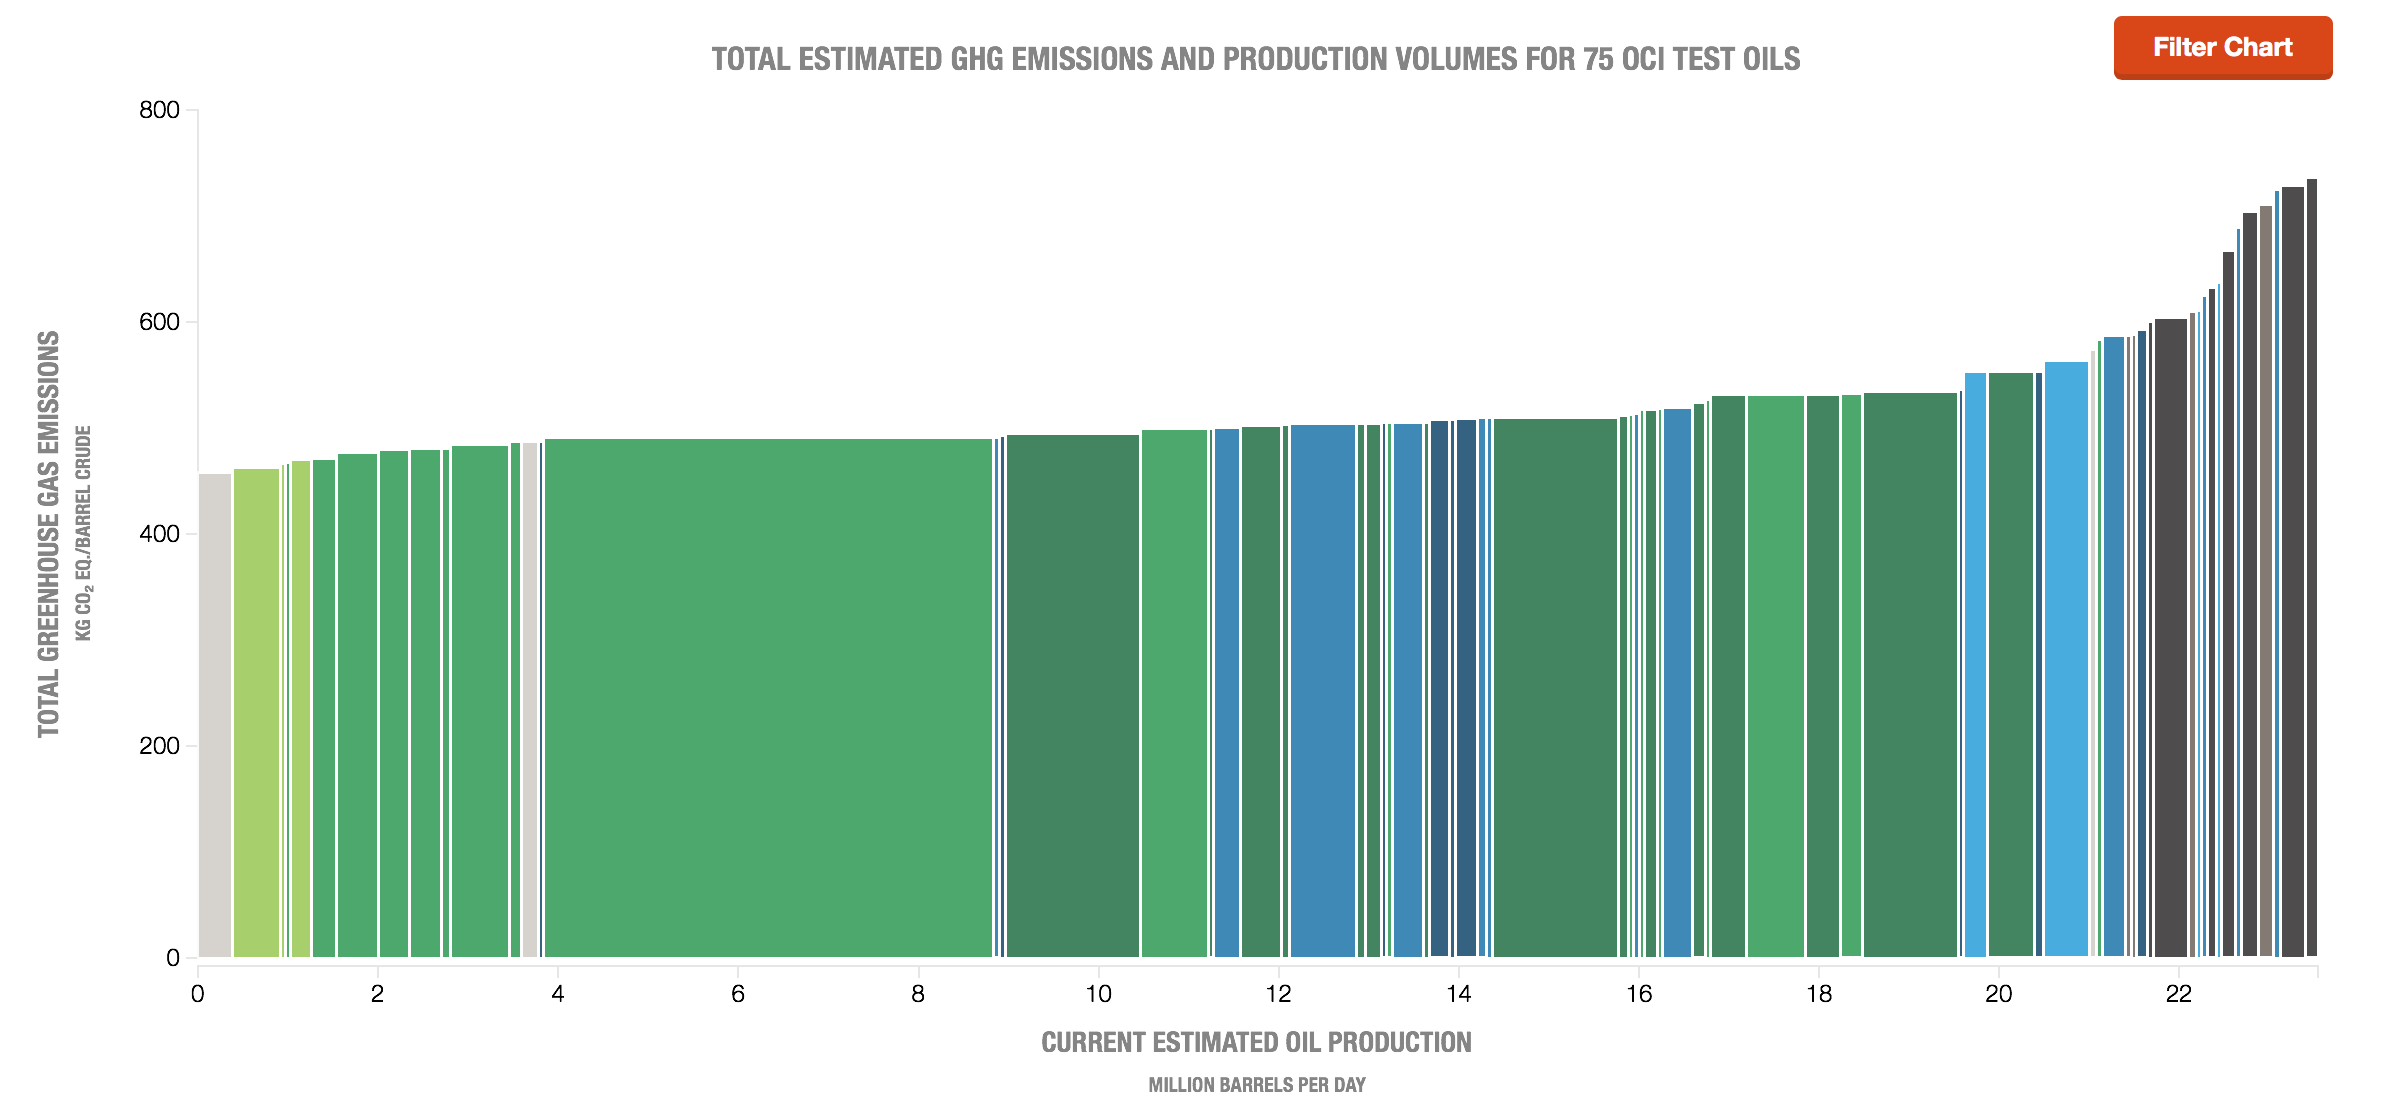
Project collaborators at the Carnegie Endowment for International Peace, Stanford University, and the University of Calgary have now collected enough open-source data to model the climate impacts of 75 global oils—25 percent of current production. Our results can be found on the new OCI 2.0 web tool at OCI.CarnegieEndowment.org. The OCI’s new look and functionality include a global oil map, oil field boundaries, flaring data, carbon tax calculator, in-depth comparison tools, information on related oils, and more.
This release features a new OCI publication, “Getting Smart About Oil in a Warming World.” And you can view demonstration videos that pose critical questions about oil-climate responsibilities and strategies. Stay tuned for a forthcoming report that highlights promising supply chain innovations in the oil sector. These and all related publications, events, and media are (or will be, for future pubs) archived on Carnegie’s OCI webpage.
We look forward to introducing the OCI 2.0 and its many energy and climate applications to you.
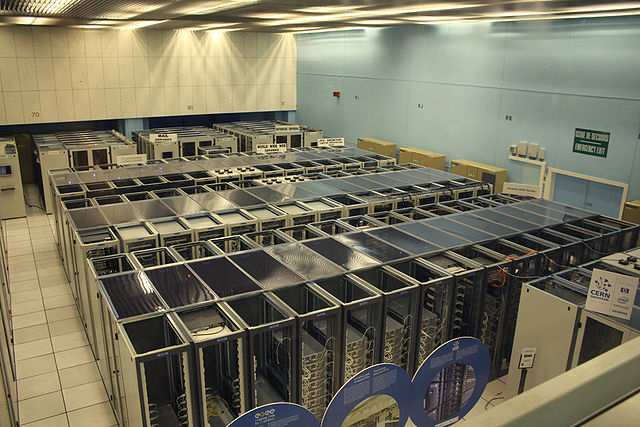
Cern datacenter Photo credit: By Hugovanmeijeren (Own work) [GFDL or CC-BY-SA-3.0-2.5-2.0-1.0], via Wikimedia Commons
I’ve been struggling for years to convince executives in large enterprises to fix the incentive, reporting, and other structural problems in data centers. The folks in the data center know that there are issues (like having separate budgets for IT and facilities) but fixing those problems is “above their pay grade”. That’s why we’ve been studying the clever things eBay has done to change their organization to take maximal advantage of IT, as summarized in this case study from 2013:
That’s also why I’ve worked with Heatspring to develop the following online course, the latest version of which starts September 26th and goes through November 6th, 2016:
This is a unique opportunity to spend six weeks learning from Jonathan Koomey, a Research Fellow at the Steyer-Taylor Center for Energy Policy and Finance at Stanford University, and one of the foremost international experts on data center energy use, efficiency, organization, and management.
This course provides a road map for managers, directors, and senior directors in Technology Business Management (TBM), drawing upon real-world experiences from industry-leading companies like eBay and Google. The course is designed to help transform enterprise IT into a cost-reducing profit center by mapping the costs and performance of IT in terms of business KPIs.
Executives in this course will gain access to templates and best practices used by leaders in your data center. You’ll use these templates to complete a Capstone Project, in which you will propose management changes for your organization to help increase business agility, reduce costs, and move their internal IT organization from being a cost center to a cost-reducing profit center.
I’m excited about this class, but we need more signups. Please spread the word!
I’ve now developed an introductory class (in collaboration with Heatspring) specifically targeted to VP and C level executives who want to transform their data centers into cost reducing profit centers. It’s called Data Center Essentials for Executives–A Beginner’s Guide. For a modest investment of time (about 1.5 hours in total) this short course offers a high level summary of steps every company can take to improve the business performance of its IT organization.
Students can sign up at any time and take the class whenever is convenient. I encourage those who sign up to reach out to me via email with specific questions.
This June, we published a big story—Shane Bauer’s account of his four-month stint as a guard in a private prison. That’s “big,” as in XXL: 35,000 words long, or 5 to 10 times the length of a typical feature, plus charts, graphs, and companion pieces, not to mention six videos and a radio documentary.
It was also big in impact. More than a million people read it, defying everything we’re told about the attention span of online audiences; tens of thousands shared it on social media. The Washington Post, CNN, and NPR’s Weekend Edition picked it up. Montel Williams went on a Twitter tear that ended with him nominating Shane for a Pulitzer Prize (though that’s not quite how it works). People got in touch to tell us about their loved ones’ time in prison or their own experience working as guards. Lawmakers and regulators reached out. (UPDATE: And on August 18, the Justice Department announced that it will no longer contract with private prisons, which currently hold thousands of federal inmates—a massive policy shift.)
In the wake of our investigation, lots of people offered thoughts similar to this, from New Yorker TV critic Emily Nussbaum:
Incidentally,that Shane Bauer Mother Jones undercover investigation is literally why journalism exists and why we have to pay for it.
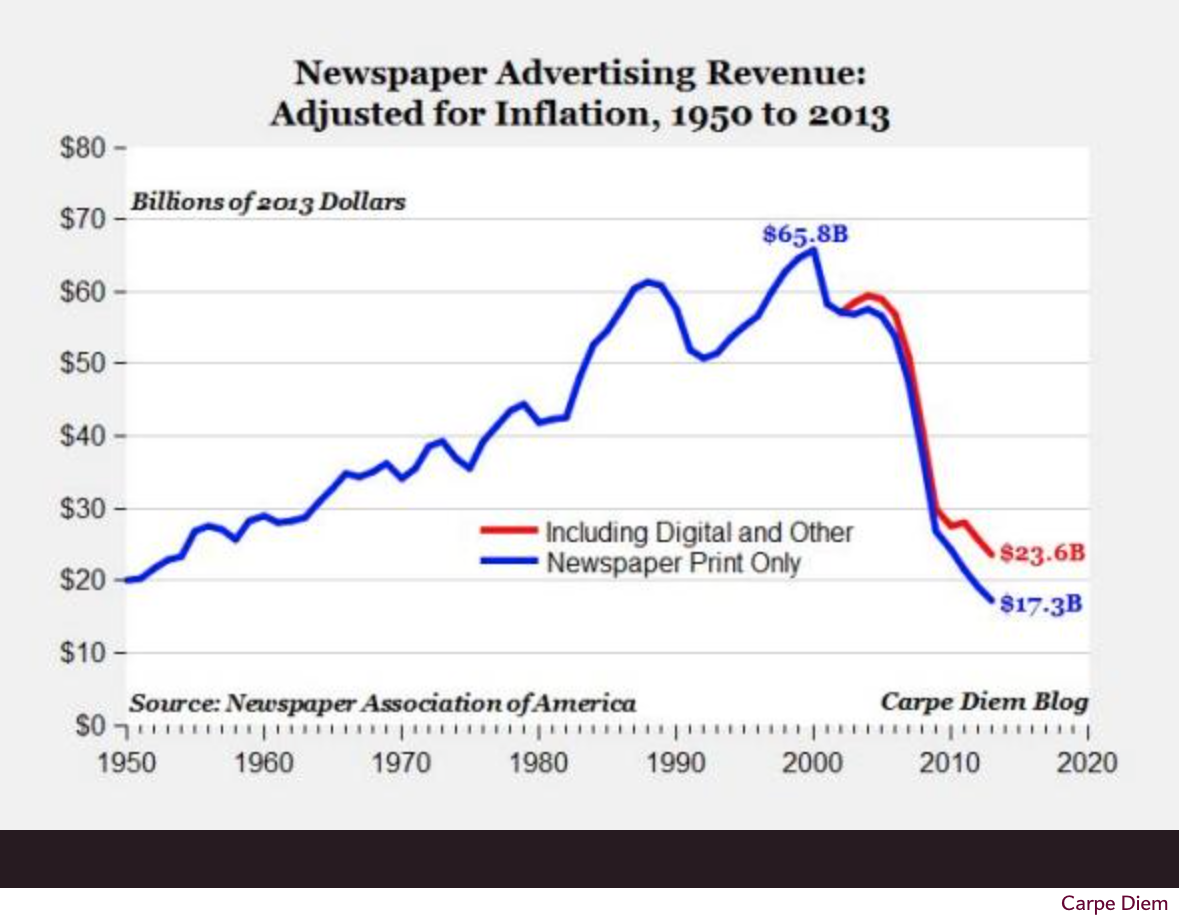
That’s a great sentiment, and we agree! But it also takes us to a deeper story about journalism and today’s media landscape. It starts with this: The most important ingredient in investigative reporting is not brilliance, writing flair, or deep familiarity with the subject (though those all help). It’s something much simpler—time.
And of course, time is money! Here’s the key takeaway:
Conservatively, our prison story cost roughly $350,000. The banner ads that appeared in it brought in $5,000, give or take.


