I had a wide ranging conversation with Chris Nelder that he recorded for his Energy Transitions podcast series, posted today. We covered a lot of ground, as the description reveals:
Should we tweak our markets to keep nuclear plants alive, or forget about markets and pay for them another way… and do we really need them at all to keep the grid functioning? Is nuclear power really declining because of overzealous environmentalists, or are there other reasons? Is it possible to balance a grid with a high amount of variable renewables and no traditional baseload plants? Is cost-benefit analysis the right way to approach energy transition? How much “decoupling” can we do between the economy and energy consumption, and how can we correctly measure it? Why are we so bad at forecasting energy and economic growth, and how can we do it better? How will energy transition affect the economy?
Good thing I came up for air in between topics! I enjoyed chatting with Chris–I always learn something from him. And I can chalk up this opportunity to Twitter, because I met him through our Twitter interactions.
1. Greenhouse gases were the highest on record. 2. Global surface temperature was the highest on record. 3. Sea surface temperature was the highest on record. 4. Global upper ocean heat content highest on record. 5. Global sea level rose to a new record high in 2015. 6. Tropical cyclones were well above average, overall. 7. The Arctic continued to warm; sea ice extent remained low.
If anyone still has any doubt that the earth is warming and humans are responsible, they should read this document!
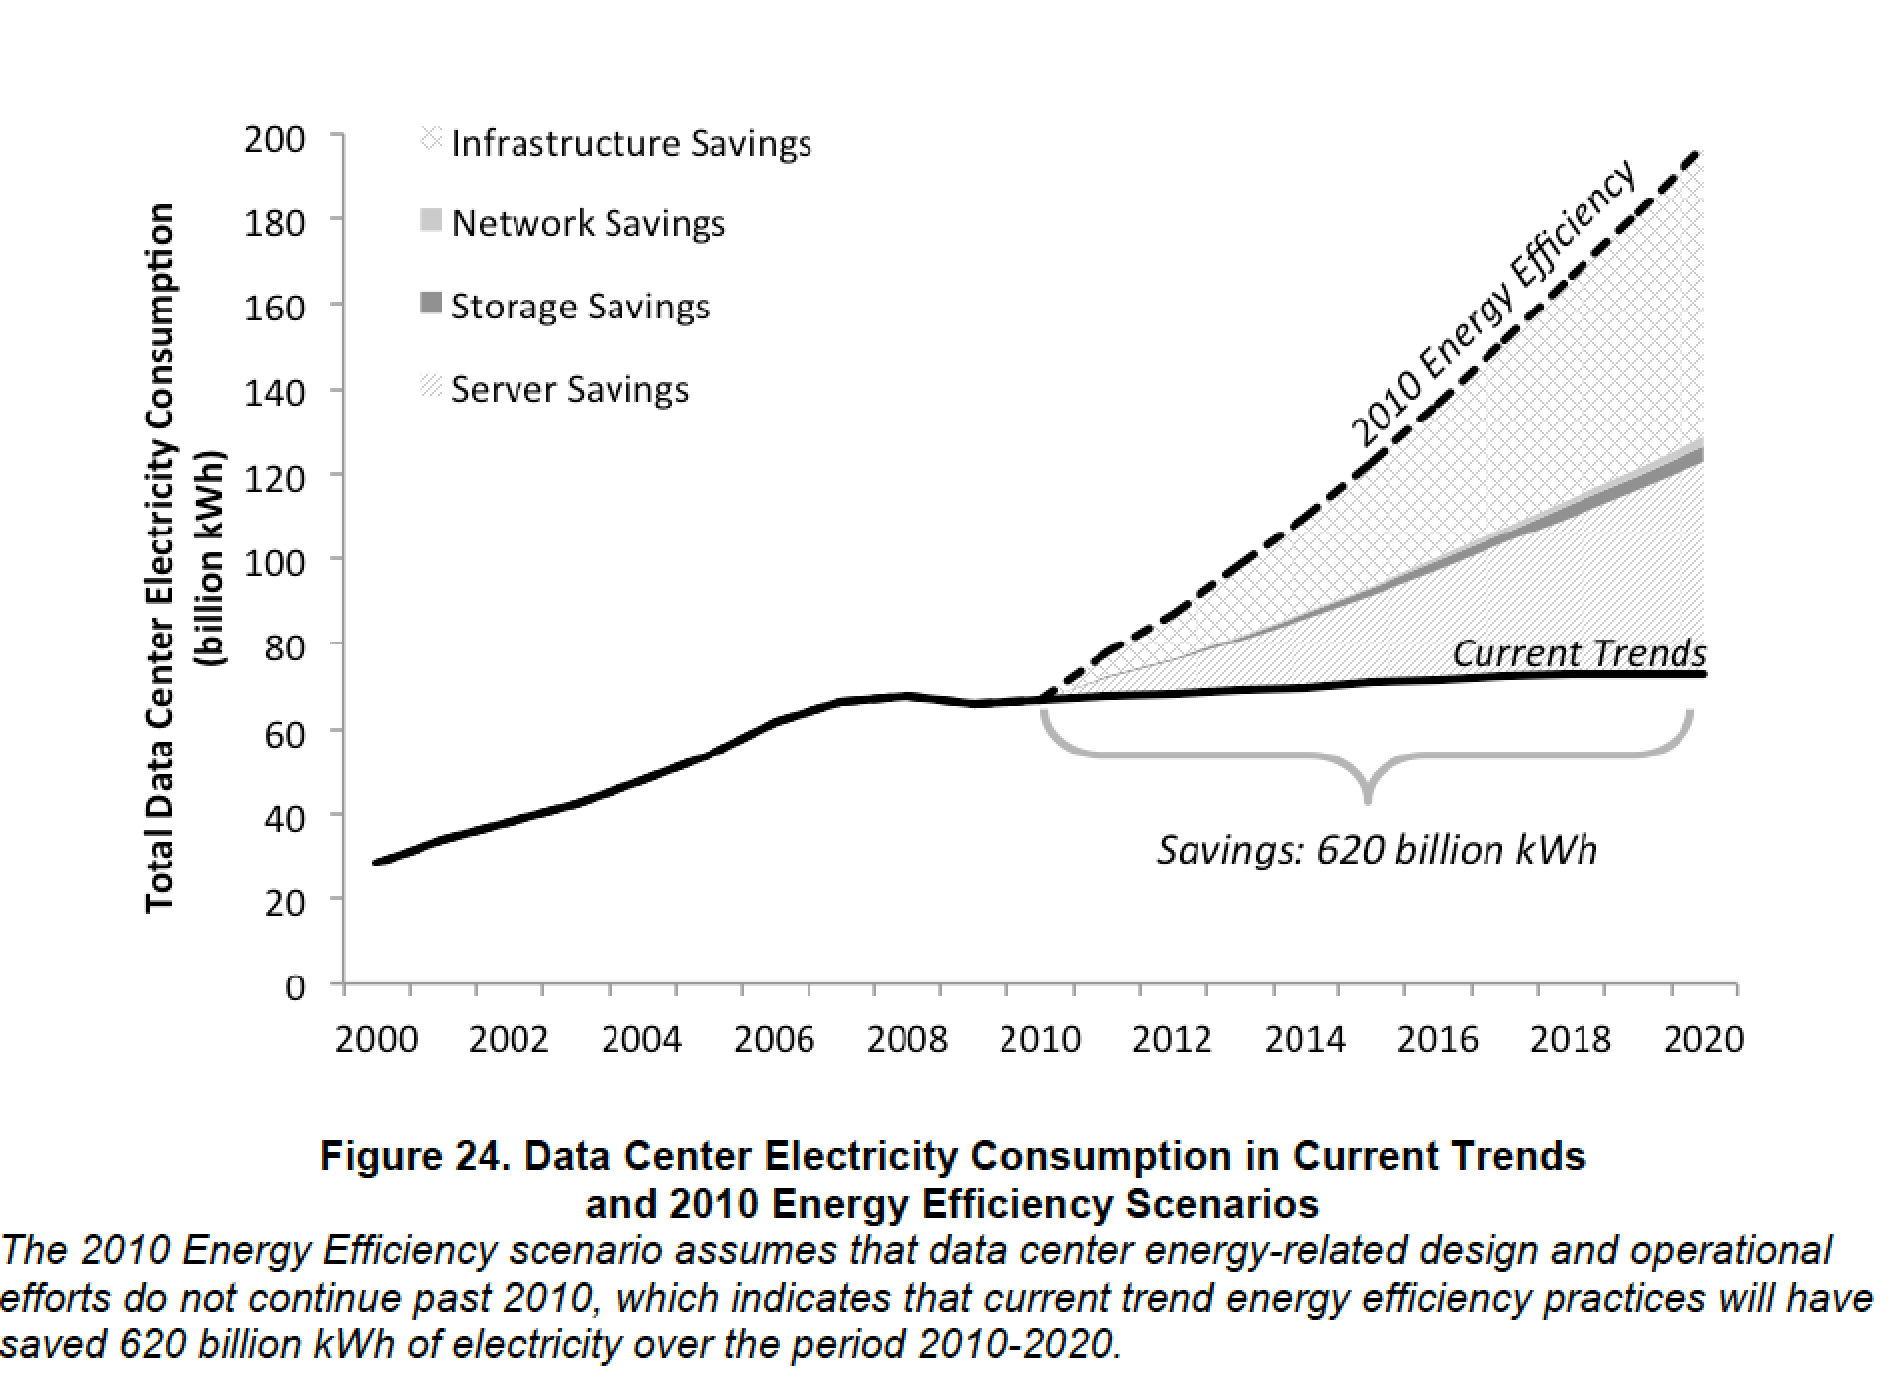
Lawrence Berkeley National Laboratory, in collaboration with experts at Stanford (me), Carnegie Mellon, and Northwestern, today released our latest analysis of electricity used by data centers in the US. Surprisingly, electricity use in data centers has been roughly flat since the financial crisis with little growth projected to 2020, even though delivery of computing services has been increasing rapidly. As I’ve argued for years, the level of inefficiency in enterprise data center facilities leaves lots of room for improvement, and the market is finally getting that message.
Here are the first couple of paragraphs of the executive summary:
This report estimates historical data center electricity consumption back to 2000, relying on previous studies and historical shipment data, and forecasts consumption out to 2020 based on new trends and the most recent data available. Figure ES-1 provides an estimate of total U.S. data center electricity use (servers, storage, network equipment, and infrastructure) from 2000-2020. In 2014, data centers in the U.S. consumed an estimated 70 billion kWh, representing about 1.8% of total U.S. electricity consumption. Current study results show data center electricity consumption increased by about 4% from 2010-2014, a large shift from the 24% percent increase estimated from 2005-2010 and the nearly 90% increase estimated from 2000-2005. Energy use is expected to continue slightly increasing in the near future, increasing 4% from 2014-2020, the same rate as the past five years. Based on current trend estimates, U.S. data centers are projected to consume approximately 73 billion kWh in 2020.
Many factors contribute to the overall energy trends found in this report, though the most conspicuous change may be the reduced growth in the number of servers operating in data centers. While shipments of new servers into data centers continue to grow every year, the growth rate has diminished over the past 15 years. From 2000-2005, server shipments increased by 15% each year resulting in a near doubling of servers operating in data centers. From 2005-2010, the annual shipment increase fell to 5%, partially driven by a conspicuous drop in 2009 shipments (most likely from the economic recession), as well as from the emergence of server virtualization across that 5-year period. The annual growth in server shipments further dropped after 2010 to 3% and that growth rate is now expected to continue through 2020. This 3% annual growth rate coincides with the rise in very large “hyperscale” data centers and an increased popularity of moving previously localized data center activity to colocation or cloud facilities. In fact, nearly all server shipment growth since 2010 occurred in servers destined for large hyperscale data centers, where servers are often configured for maximum productivity and operated at high utilization rates, resulting in fewer servers needed in the hyperscale data centers than would be required to provide the same services in traditional, smaller, data centers.
Here’s the full reference:
Shehabi, Arman, Sarah Smith, Dale A. Sartor, Richard E. Brown, Magnus Herrlin, Jonathan G. Koomey, Eric R. Masanet, Nathaniel Horner, Inês Lima Azevedo, and William Lintner. 2016. United States Data Center Energy Usage Report. Berkeley, CA: Lawrence Berkeley National Laboratory. LBNL-1005775. June 27. [http://eta.lbl.gov/publications/united-states-data-center-energy-usag]
“Impossible is just a big word thrown around by small men who find it easier to live in the world they’ve been given than to explore the power they have to change it. Impossible is not a fact. It’s an opinion. Impossible is not a declaration. It’s a dare. Impossible is potential. Impossible is temporary. Impossible is nothing.”
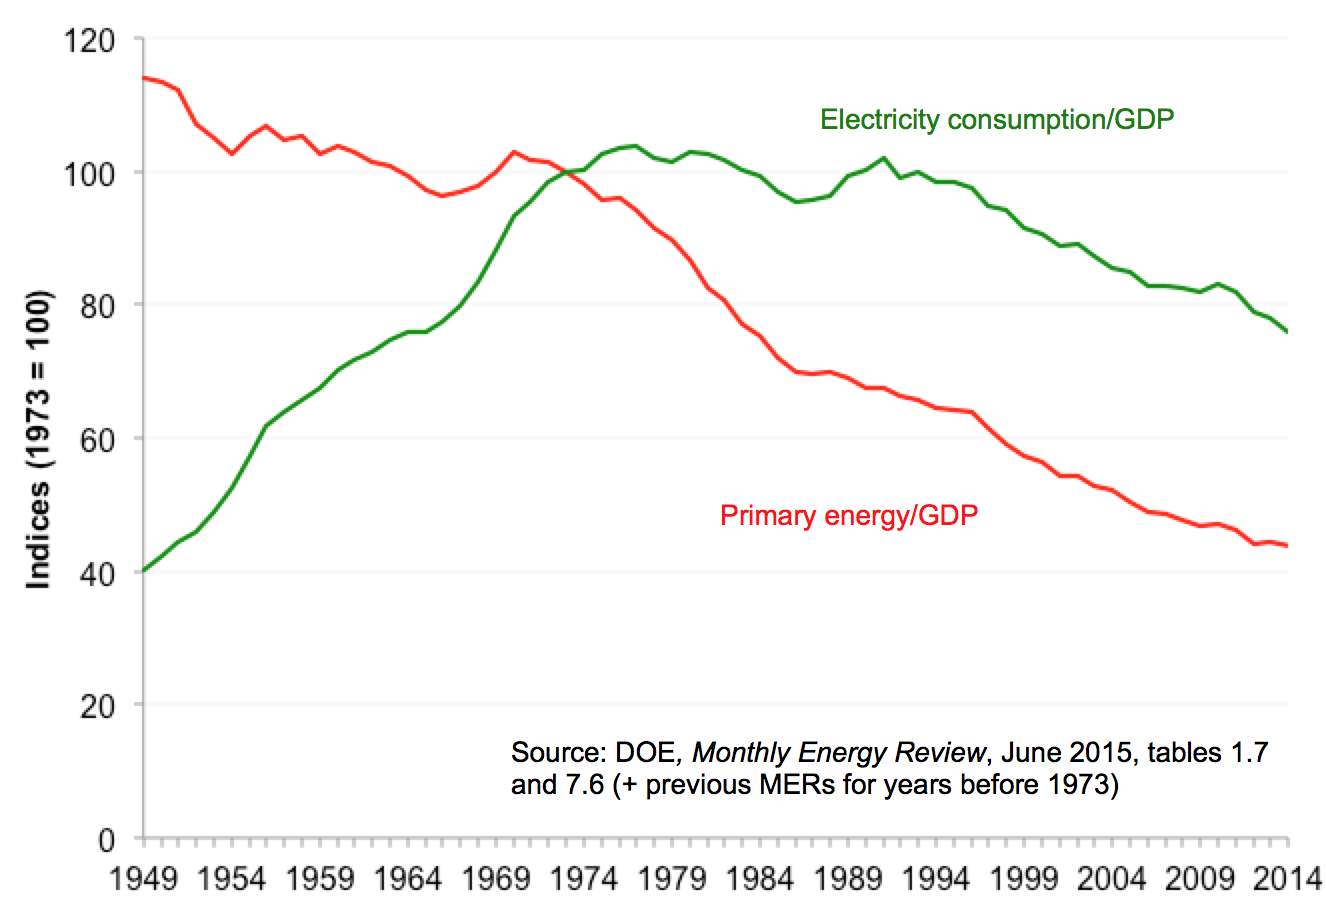
Graph of energy and electricity/GDP indices taken from Hirsh and Koomey 2015 (subscription required). The graphs illustrate structural changes in the relationship between energy and economic activity that have confounded modelers in the past and will no doubt do so in the future.
This webinar explores why (with few exceptions) models of economic systems do not yield accurate predictions about the future. Predictions can be accurate when systems have consistent structure (geographically and temporally) and when there are no surprises, but neither of these conditions holds for virtually all economic systems. Physical systems can exhibit structural constancy, so predictions based on physical sciences can be accurate (barring surprises). The webinar also explores implications of this irreducible uncertainty, introduces ways to cope with it, and discusses responsible use of economic modeling tools in the face of such modeling limitations. The talk explores these issues using examples of forecasts of US primary energy use, oil prices, electricity demand, and the costs of nuclear power.
Addendum, June 1, 2016: Some of the participants in the workshop wanted to understand why economic modelers have a hard time accepting the thesis of my talk. I pointed them to a November 30, 2014 NYT blog post by Paul Krugman about the sociology of economics that is revealing. The Krugman post refers to a study that will be fascinating for anyone interested in how the economic community operates.
Here are the opening paragraphs of the DCD article:
Twenty first century data centers are the crown jewels of global business. No modern company can run without them, and they deliver business value vastly exceeding their costs. The big hyperscale computing companies (like Google, Microsoft, Amazon, and Facebook) are the best in the industry at extracting that business value, but for many enterprises whose primary business is not computing, the story is more complicated.
If you work in such a company, you know that data centers are often strikingly inefficient. While they may still be profitable, their performance still falls far short of what is possible. And by “far short” I don’t mean by 10 or 20 percent, I mean by a factor of ten or more.
The course will teach people how to bring their data centers into the twenty first century, turning them from cost centers into cost-reducing profit centers.
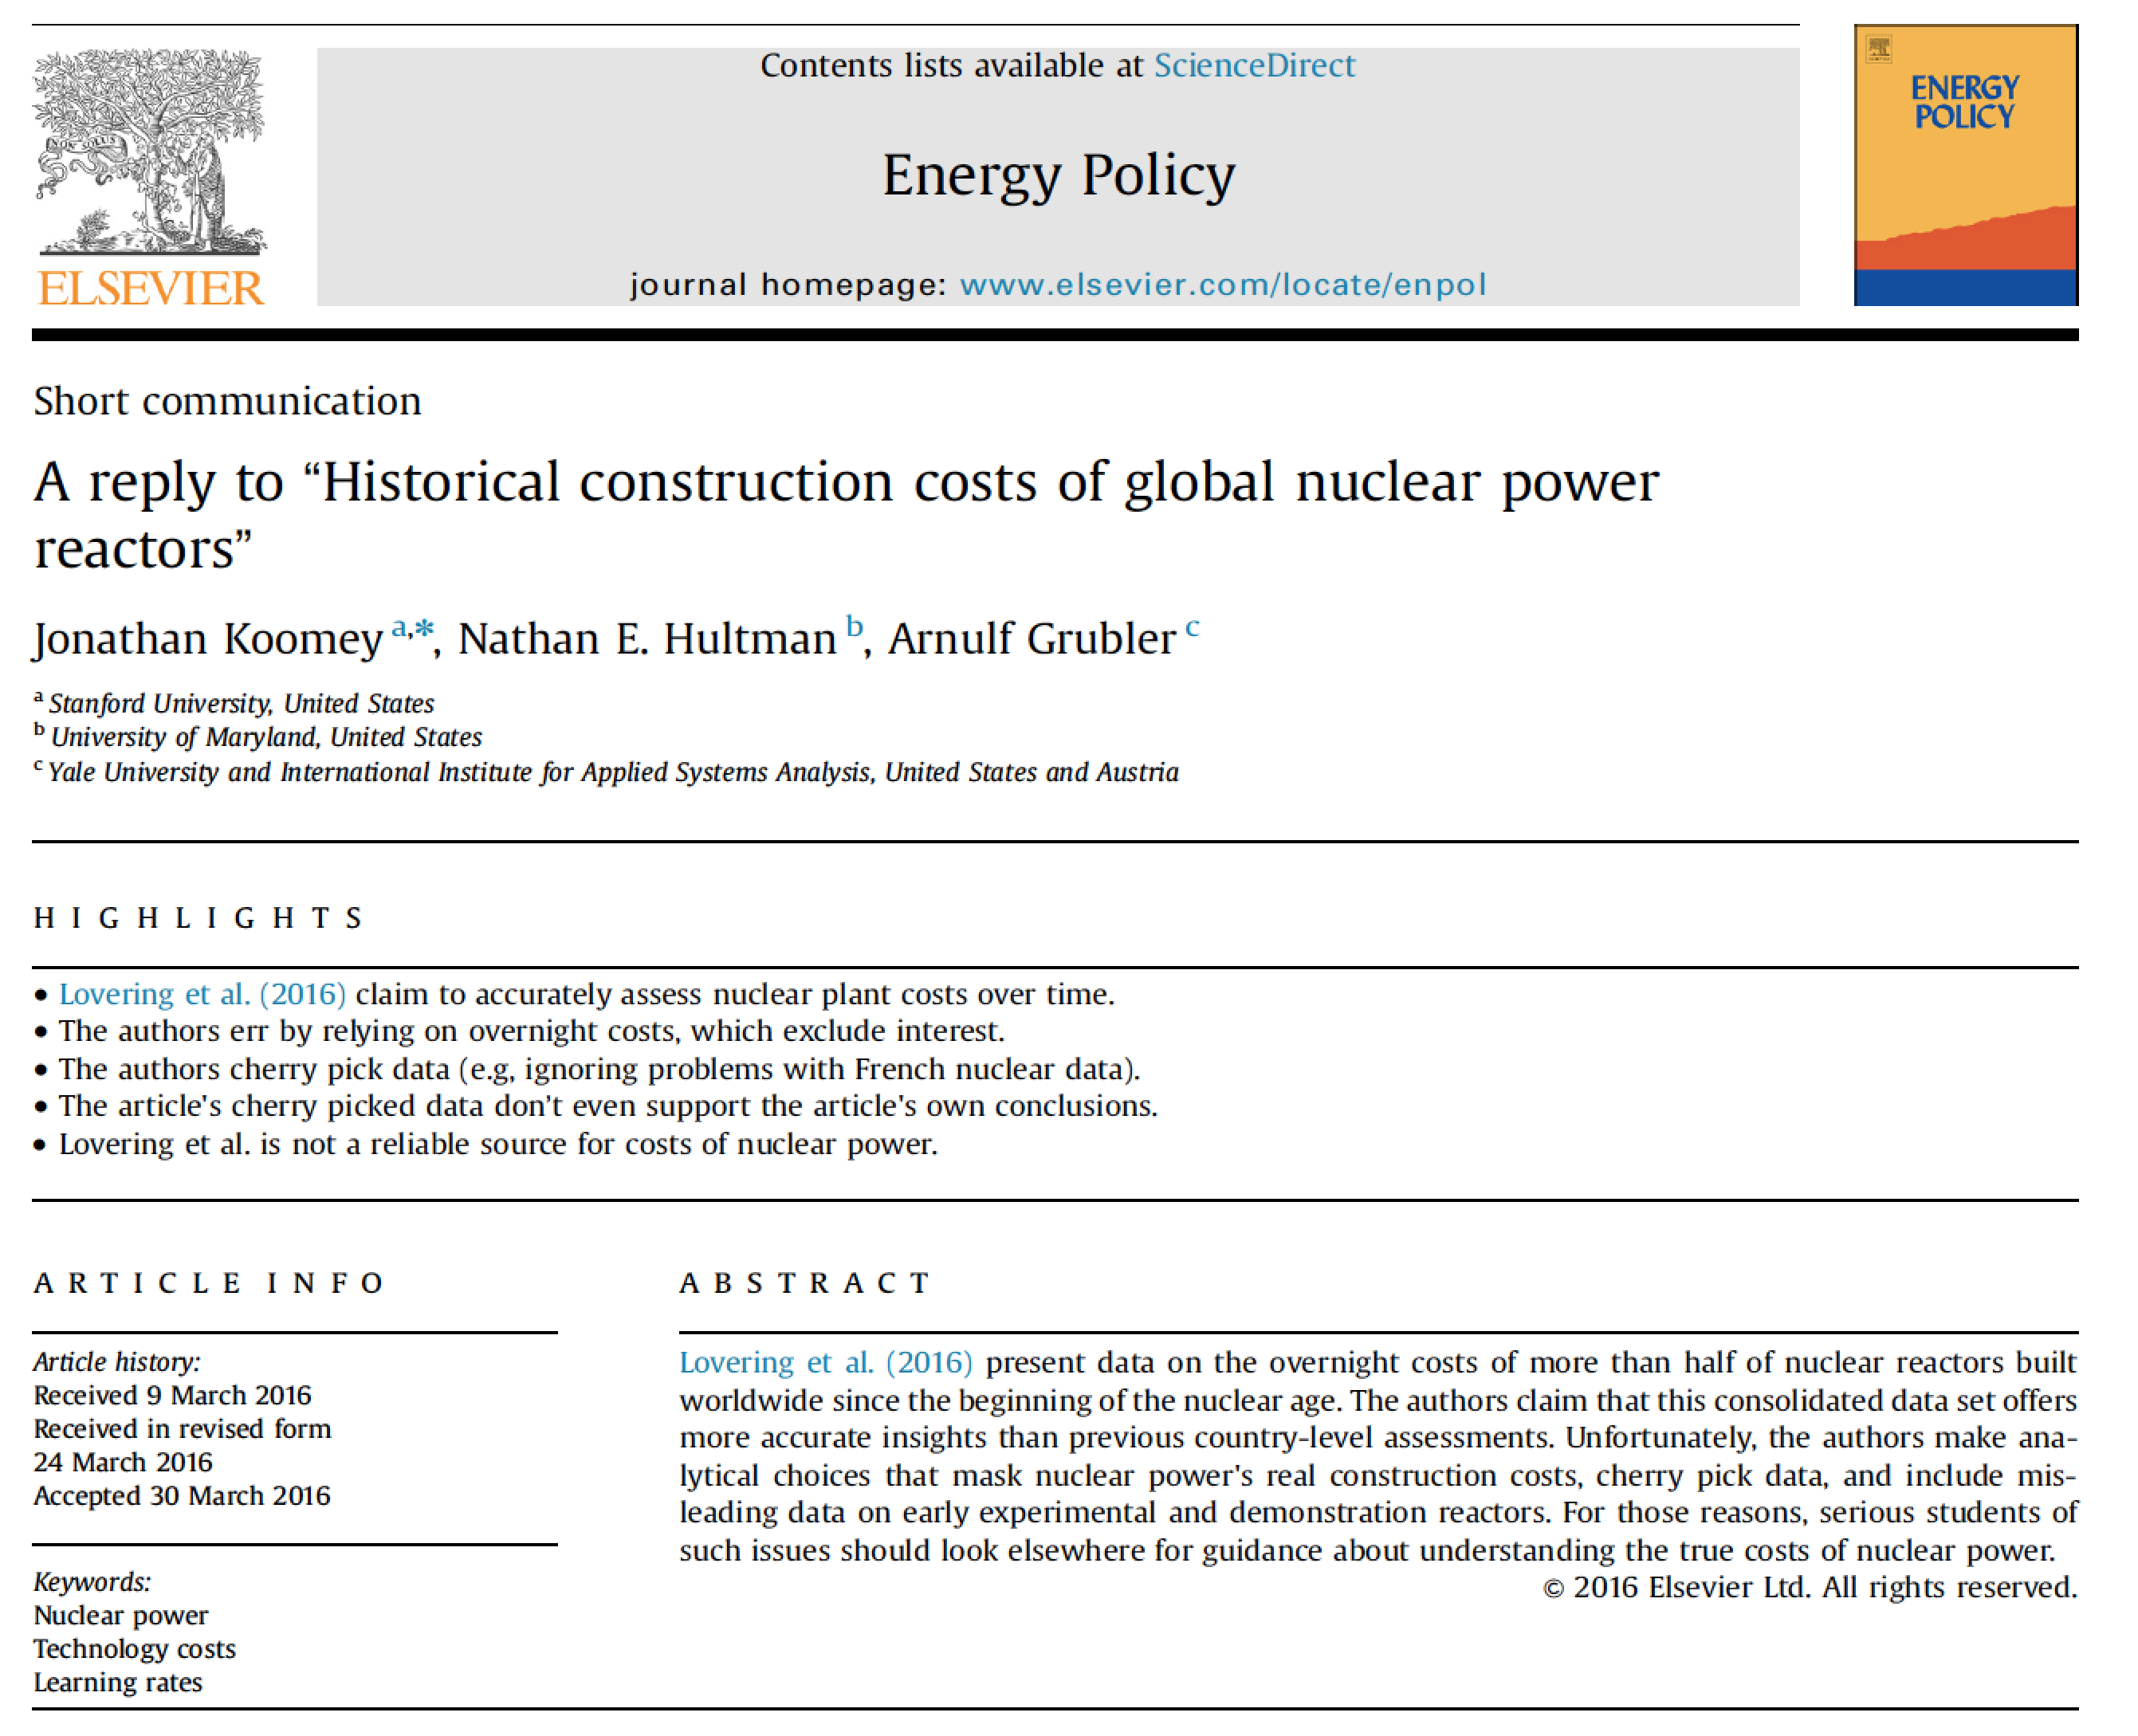
Our article critiquing the recent Lovering et al. Energy Policy article on the costs of nuclear power was just published online by Energy Policy (the article is now considered to be “in press” with only minor tweaks to come once they assign the article to an issue). My colleagues Nate Hultman at the University of Maryland and Arnulf Grubler of Yale University and the International Institute of Applied Systems Analysis teamed up with me on the critique.
Here’s the abstract:
Lovering et al. (2016) present data on the overnight costs of more than half of nuclear reactors built worldwide since the beginning of the nuclear age. The authors claim that this consolidated data set offers more accurate insights than previous country-level assessments. Unfortunately, the authors make analytical choices that mask nuclear power’s real construction costs, cherry pick data, and include misleading data on early experimental and demonstration reactors. For those reasons, serious students of such issues should look elsewhere for guidance about understanding the true costs of nuclear power.
Here are the references for the relevant articles:
Koomey, Jonathan, Nathan E. Hultman, and Arnulf Grubler. 2016. “A reply to "Historical construction costs of global nuclear power reactors”.“ Energy Policy. April. [http://dx.doi.org/10.1016/j.enpol.2016.03.052]
Alex Gilbert, Ben Sovacool, Phil Johnstone, and Andy Stirling also did a critique of Lovering et al. that should appear in the same issue (it’s also “in press”):
Gilbert, Alexander, Benjamin K. Sovacool, Phil Johnstone, and Andy Stirling. “Cost overruns and financial risk in the construction of nuclear power reactors: A critical appraisal.” Energy Policy. [http://www.sciencedirect.com/science/article/pii/S0301421516301690]
Our understanding was that the editor sought out a response to our critiques from Lovering et al, but we don’t know when that one will appear. We were told initially that it would appear at the same time as our articles.
Please email me if you’d like a copy of our article, or download directly if you have access through your university.
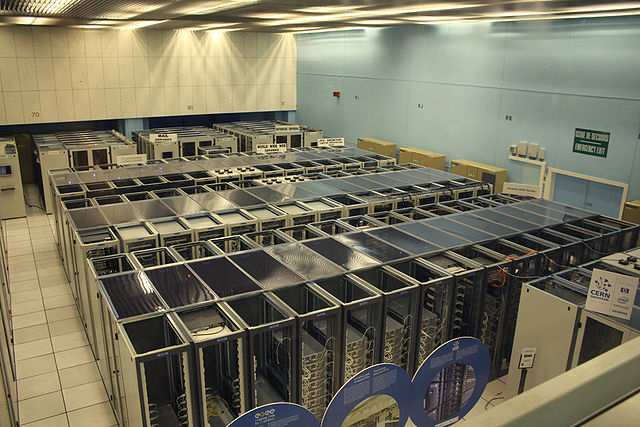
Cern datacenter Photo credit: By Hugovanmeijeren (Own work) [GFDL or CC-BY-SA-3.0-2.5-2.0-1.0], via Wikimedia Commons
I’ve been struggling for years to convince executives in large enterprises to fix the incentive, reporting, and other structural problems in data centers. The folks in the data center know that there are issues (like having separate budgets for IT and facilities) but fixing those problems is “above their pay grade”. That’s why we’ve been studying the clever things eBay has done to change their organization to take maximal advantage of IT, as summarized in this case study from 2013:
Schuetz, Nicole, Anna Kovaleva, and Jonathan Koomey. 2013. eBay: A Case Study of Organizational Change Underlying Technical Infrastructure Optimization. Stanford, CA: Steyer-Taylor Center for Energy Policy and Finance, Stanford University. September 26.
That’s also why I’ve worked with Heatspring to develop the following online course, the third instance of which starts May 2nd and goes through June 12th, 2016:
This is a unique opportunity to spend six weeks learning from Jonathan Koomey, a Research Fellow at the Steyer-Taylor Center for Energy Policy and Finance at Stanford University, and one of the foremost international experts on data center energy use, efficiency, organization, and management.
This course provides a road map for managers, directors, and senior directors in Technology Business Management (TBM), drawing upon real-world experiences from industry-leading companies like eBay and Google. The course is designed to help transform enterprise IT into a cost-reducing profit center by mapping the costs and performance of IT in terms of business KPIs.
Executives in this course will gain access to templates and best practices used by leaders in your data center. You’ll use these templates to complete a Capstone Project, in which you will propose management changes for your organization to help increase business agility, reduce costs, and move their internal IT organization from being a cost center to a cost-reducing profit center.
I’m excited about this class, but we need more signups by early May. Please spread the word by sending this blog post to upper level management in the company where you work.
CC BY-SA 3.0 File:Bouncing ball strobe edit.jpg Created: 29 September 2007
More excuses from the Breakthrough Institute on data quality
Dr. Harry Saunders, a Senior Fellow at the Breakthrough Institute, has responded to our criticism of his work on the rebound effect. For completeness we will address some new issues he has raised, but at this point our exchange has thoroughly covered the disputed territory. We stand by our concerns and encourage interested readers to review the published journal articles (Saunders, 2013; Cullenward and Koomey, 2016), our original summary post, our response to initial Breakthrough Institute comments at our website and on social media, and Dr. Saunders’ new essay.
Too little, too late
Considering the significant errors we identified in Dr. Saunders’ published article, his latest reaction is a remarkable exercise in deflection. As described in our original post, we have clearly demonstrated that his data did not match his methods:
Dr. Saunders’ data actually concern national average prices, not the sector- and location-specific marginal prices that energy economists agree are necessary to evaluate the rebound effect. The distinction is most important because actual energy prices vary widely by sector and location; in addition, economic theory asserts that changes in the marginal (not the average) price of energy services cause the rebound effect. As a result, Dr. Saunders’ findings of high rebound and backfire are wholly without support.
Despite acknowledging these significant methodological inconsistencies, Dr. Saunders continues to insist they do not matter and that the burden is on his critics to show that his results are invalid. While he is free to make the case for why the mistakes we identified don’t affect his results, it’s worth reminding readers that this is a discussion we should have been having five years ago—and certainly by the time Dr. Saunders published his 2013 article, which entirely ignored the concerns we had already raised with him.
The problems we identify call for far more than an additional caveat in Dr. Saunders’ work because they show his study lacks a valid empirical basis. This episode also counsels serious skepticism of rebound-related research from the Breakthrough Institute, which breathlessly promoted Dr. Saunders’ work as a “detailed econometric analysis” and “rigorous new methodology”;[1]“an important contribution to the study of rebound effects that fills a key void in analyses of rebound for producing sectors of the economy”;[2] a “fruitful path for further examination of rebound effects”;[3]; and the very essence of intellectual modesty, with an “extensive discussion”[4] of cautions and limitations that “are rigorously illuminated by the author.”[5]
Yet when confronted with serious concerns about the empirical basis of the study—both privately within the expert community five years ago and publicly again this year—Dr. Saunders and his colleagues at the Breakthrough Institute doubled down on aggressive and unsubstantiated findings that fit their political narrative on rebound, not the facts.
A cursory look at the wrong data
Instead of acknowledging serious analytical errors, Dr. Saunders defends his results by asserting that there is no difference, econometrically speaking, between changes in national and state-level average energy prices. According to Dr. Saunders, there is no difference in the variation of prices observed at the state and national levels. Therefore, he claims his published results are unaffected by using national average prices in a model that estimates industry-specific rebound effects. He makes his case by analyzing EIA fuel price data for California, Texas, and the United States.
This effort falls well short of excusing his paper’s mistakes.
First of all, analyzing EIA price data doesn’t tell us anything about the validity of Dr. Saunders’ 2013 article because he used a completely different data set in that study. Again, Dr. Saunders’ paper relied on a data set from Professor Jorgenson, which, as we have repeatedly pointed out, is inconsistent with EIA’s more reliable data in the few instances where the categorization of the two data sets is even roughly comparable. On top of that, the Jorgenson data are explicitly constructed from non-EIA data sources. So how do patterns in the EIA data support Dr. Saunders’ approach?
Second, Dr. Saunders once again avoids confronting his model’s complete lack of primary data. Comparing state and national prices does not speak to the difference between national prices and the industry-specific prices Dr. Saunders incorrectly claimed his data provide. While it would be nice to see the difference the use of correct data would make, there are no primary energy price data at the level of Professor Jorgenson’s industrial classifications, which approximate—but only roughly—the 2-digit SIC classification scheme.[6]
The lack of data reflects the fact that five energy-producing sectors in Professor Jorgenson’s data do not correspond well to real-world energy markets. For example, the data have a combined oil and gas extraction sector, which is assigned a single national price; however, the relationship between oil and natural gas prices in North American energy markets is far more complex than a single composite price index could reasonably represent over nearly five decades. Section 9 in our published article’s Supplemental Information reviews this and several related concerns in detail.
Third, Dr. Saunders makes a very limited case that EIA data show little difference in energy price variation at the state and national levels. For one thing, he presents detailed data for only two states, not fifty.[7] Perhaps more importantly, he compares trends across incongruous time periods. His published article runs a model over 45 years of data (1960-2005), but in his blog post, Dr. Saunders compares state and national data across different time periods for natural gas (1967-2014), distillate fuel oil (1983-2010), residual fuel oil (1983-2010), and electricity (1990-2014). This is hardly a firm basis for establishing a fixed relationship between price trends over a much longer period; and it is all the more problematic because the statistical match he reports is actually quite poor for electricity, a key fuel for price-sensitive, energy-intensive industries that have historically been located in areas with distinct electricity fuel mixes (e.g., hydropower in the Pacific Northwest or coal in the Rust Belt).
Finally, Dr. Saunders glosses over the significant problem of using average prices to study the rebound effect. He acknowledges that “[i]n a microeconomic sense, it is true that producer decisions depend on marginal prices rather than average prices.” But he claims his paper’s reliance on average price data is acceptable because his econometric model takes as input the change in prices, not absolute prices. Implicit in this claim is the rather bold assertion that variation in marginal and average prices are statistically equivalent—a proposition without any support whatsoever in either his blog post or paper. By using average prices, Dr. Saunders rejects the standard approach in microeconomics and thereby fails to distinguish between rebound effects and all other behavioral responses to energy prices.
As a result, Dr. Saunders’ response fails to address the data quality concerns we raised in our paper.
Garbage in, garbage out
Then there is the question of the theoretical validity of Dr. Saunders’ model, a topic our response article explicitly did not address (see footnote 6 on page 206 of our published paper). Dr. Saunders mistakes our silence as evidence that his model is unassailable:
In many ways, the Cullenward/Koomey critique of the Saunders article is reassuring. They have plainly taken a deep look at the analysis and, finding no methodological issues to criticize, were reduced to challenging the Jorgenson et al. dataset used in the rebound analysis.
Dr. Saunders finds a strange comfort in our criticism. We focused on data quality not for lack of other concerns, but because we are experts in U.S. energy data and knew from unrelated research projects that no primary data sources could support the paper’s analysis. If that isn’t a methodological criticism, we don’t know what is.
We were careful not to cast aspersions in our response article on those aspects of Dr. Saunders’ work we did not analyze in detail, including his model structure. Nevertheless, we aren’t convinced that his model is any more accurate than his data and reject the notion that our silence implies a failure (or even an interest) in finding problems with his model.
If anything, the errors we found in Dr. Saunders’ data suggest that those who examine his model will find problems there, too. But we need not address that issue because the inconsistencies we found in Dr. Saunders’ data are sufficiently grave to invalidate his conclusions. The first question any good analyst asks is whether the data can speak to the research question at hand. If they can’t, the details of model structure are irrelevant.
Hide-and-seek in peer review
Finally, we note that Dr. Saunders places great reliance on the fact that his 2013 article made it through peer review:
Cullenwald [sic] and Koomey simply complain that they raised concerns about problems with my data set at a Carnegie Mellon workshop in 2011. This is indeed the case. I subsequently published my analysis, and it passed peer-reviewed muster, because … there is no evidence that those concerns are particularly material to the conclusions of my analysis.
Unfortunately, the quality control mechanisms of peer review should give readers little comfort in this instance. Dr. Saunders did not disclose any data quality issues to reviewers, who were ill equipped to assess the issue as a result.
We are grateful that the journal Technological Forecasting & Social Change, which published Dr. Saunders’ 2013 paper, was also willing to publish our response article. With respect, however, TF&SC is not primarily an economics journal. For example, one of our anonymous reviewers requested we explicitly define commonly understood economics terms (such as the principal-agent problem) in order to better communicate with the journal’s readers, not all of whom are familiar with standard economic jargon.
It is hard for us to imagine that peer reviewers at an interdisciplinary journal with limited readership among economists would have been able to identify the detailed data concerns we raised with Dr. Saunders in 2011 but which he did not disclose in his submission. As our response article demonstrates, his published paper fundamentally misconstrues the nature of its own data sources—an inconsistency a peer reviewer would only discover if he or she took the exceptional effort to read the references listed in Professor Jorgenson’s data documentation, not merely Dr. Saunders’ factually incorrect description of his own methodology.
Presumably Dr. Saunders had not yet realized these mistakes when he submitted his paper to the journal, in which case he has absolutely no business citing peer review as validation on this point. But this benign interpretation makes sense only if Dr. Saunders completely discounted our warning that no primary data existed at the level of specificity his model required (as one of us (D.C.) presented at a Carnegie Mellon University workshop Dr. Saunders attended in July 2011, and as both of discussed over lunch with Dr. Saunders and his colleague Jessie Jenkins in March 2011).
Alternatively, if at the time of journal submission Dr. Saunders knew (or reasonably suspected) his data didn’t match his model, it appears he withheld critical information from peer reviewers and misled the research community. Given the importance of the timing of Dr. Saunders’ realization, we would be grateful if he would clarify exactly when he realized that his data actually represent national averages, not industry-specific marginal prices.[8]
In light of the methodological inconsistencies we documented in Dr. Saunders’ work, we think the journal made the right decision to publish our peer-reviewed response article. To the extent Dr. Saunders believes the errors we documented don’t change his results, we would encourage him to make a full and complete rebuttal in the peer-reviewed economics literature.
[6] As many economists know, the federal government stopped using SIC accounting in the late 1990s. It turns out that Professor Jorgenson never bridged the SIC and newer NAICS accounting structures, and therefore had to extrapolate the last five years of his KLEMS data because no government entity publishes data in the SIC structure he retained. See Cullenward and Koomey (2016), supplemental information at Section 7.
[7] Dr. Saunders also presents a graph of commercial natural gas price data for eight states and concludes that the visual pattern of variation across these states is comparable to variation in the national average price.
[8] While Dr. Saunders explicitly (and incorrectly) claimed to be using industry-specific energy prices, his paper never specified whether these were average or marginal prices. It is entirely possible that Dr. Saunders intentionally (as opposed to mistakenly) used average prices. Whatever the case, we believe the paper should been explicit about its departure from the standard approach in microeconomics.
My friend Fred Stein at SRI alerted me to this upcoming event. I’m not able to make it, but I encourage others to attend. If you do go, please let me know what you learned!
Silicon Valley is driving how corporations operate and manage their commercial real estate more effectively using automation to make buildings smarter. As companies like Google, Apple, Facebook, and LinkedIn expand their campuses, and small companies continue to grow, their need to accommodate employees increases. Smart Building technology using the Internet of Things and data analytics is allowing these companies to design and operate intelligent work environments that allow occupants as well as property managers to work more efficiently and minimize operation costs.
Innovators in corporate real estate and building automation are working alongside Silicon Valley’s entrepreneurs vying for a position in a market that is expected to grow by $200B by 2020. How will the rise of these data-driven, intelligent buildings change the occupant experience? What data is being collected and put to use? What will change in building management? How many jobs will be affected?
Join us for an engaging panel discussion on February 16, 2016.
Moderator: Jim Young, Co-Founder & CEO, Realcomm
Panelists: Andrew Krioukov, Co-Founder & CEO, Building Robotics Vladi Shunturov, Co-Founder & President, Lucid Design Group Q Motiwala, Managing Director, Draper Nexus
Modern enterprise data centers are some of the most technically sophisticated business activities on earth. Ironically enough, they are also often bastions of inefficiency, with equipment utilization much below ten percent and 30 percent of the servers in those facilities being comatose (using electricity but performing no useful information services). The operators of these facilities also struggle to keep pace with rapid changes in deployments of computing equipment.
These problems have led to much attention being paid to improving data center management. While almost every enterprise data center has taken steps to improve its operations, virtually all are much less efficient, much more costly, and far less flexible than they could be. Those failings ultimately prevent data centers from delivering maximum business value to the companies that own them.
Well-managed data centers use what I call the three pillars of modern data center operations: tracking, procedures, and physical principles…
Cern datacenter Photo credit: By Hugovanmeijeren (Own work) [GFDL or CC-BY-SA-3.0-2.5-2.0-1.0], via Wikimedia Commons
I’ve been struggling for years to convince executives in large enterprises to fix the incentive, reporting, and other structural problems in data centers. The folks in the data center know that there are issues (like having separate budgets for IT and facilities) but fixing those problems is “above their pay grade”. That’s why we’ve been studying the clever things eBay has done to change their organization to take maximal advantage of IT, as summarized in this case study from 2013:
Schuetz, Nicole, Anna Kovaleva, and Jonathan Koomey. 2013. eBay: A Case Study of Organizational Change Underlying Technical Infrastructure Optimization. Stanford, CA: Steyer-Taylor Center for Energy Policy and Finance, Stanford University. September 26.
That’s also why I’ve worked with Heatspring to develop the following online course, the third instance of which starts May 2nd and goes through June 12th, 2016:
This is a unique opportunity to spend six weeks learning from Jonathan Koomey, a Research Fellow at the Steyer-Taylor Center for Energy Policy and Finance at Stanford University, and one of the foremost international experts on data center energy use, efficiency, organization, and management.
This course provides a road map for managers, directors, and senior directors in Technology Business Management (TBM), drawing upon real-world experiences from industry-leading companies like eBay and Google. The course is designed to help transform enterprise IT into a cost-reducing profit center by mapping the costs and performance of IT in terms of business KPIs.
Executives in this course will gain access to templates and best practices used by leaders in your data center. You’ll use these templates to complete a Capstone Project, in which you will propose management changes for your organization to help increase business agility, reduce costs, and move their internal IT organization from being a cost center to a cost-reducing profit center.
I’m excited about this class, but we need more signups by early May. Please spread the word by sending this blog post to upper level management in the company where you work.
The reports produced by the Intergovernmental Panel on Climate Change contain the sum total of scientific knowledge on climate change science, mitigation, and adaptation. The long lead times needed to produce such comprehensive documents means that they inevitably omit the latest scientific findings when the reports are finally approved and published, but those reports are still a treasure trove for researchers working on most aspects of climate science and solutions.
What are great resources for researchers, however, are not necessarily accessible for the intelligent lay reader. For that much broader audience there is the excellent compilation of the IPCC’s findings from Professors Michael E. Mann and Lee R. Kump of Pennsylvania State University. The book, titled Dire Predictions: Understanding Climate Change—the Visual Guide to the Findings of the IPCC, is now out in its second edition.
A real strength of this book is that the authors distill what’s important, so you don’t have to. The book is visual, as the title implies. It has pictures on every page, and is chock full of key graphs from the IPCC reports. The prose is clear and concise, and is written for a Scientific American level audience (i.e., lay readers who take an intelligent interest in science and who are not scared off by graphs). If graphs aren’t your thing, you can still learn a great deal by just reading the text.
The structure of the book is very close to the 1stedition, with five major sections:
Part 1: Climate Change Basics
Part 2: Climate Change Projections
Part 3: The Impacts of Climate Change
Part 4: Vulnerability and Adaptation to Climate Change
Part 5: Solving Climate change
In each section you’ll find short (1-3 page) sections covering each key topic, so it’s relatively easy going. The 2nd edition contains 16 more pages than the 1st edition, and that new material highlights findings that have become more salient in recent years. Those new topics include:
Where is all that heat going?
Suffocating the ocean
Welcome to the Anthropocene
The 2012 North American heat wave
Comparing climate model predictions with observations
How sensitive is the climate?
Fossil-fuel emissions scenarios
The “faux pause”
Past IPCC projections: How did they do?
Tipping points, irreversibilities, and abrupt climate change
It’s all about the economy
The water-energy nexus
Dire Predictions is a wonderful summary of climate science for the lay reader, and I highly recommend it. If you pair it with Joe Romm’s Climate Change: What Everyone Needs to Know (which is equally readable and contains more extensive treatment of climate economics, policy, and solutions) you’ll have complete and up to date knowledge of climate change and what we can do about it. Both books together would work well as the basis for high school, college, and graduate level classes, or as the core resources for reading clubs exploring climate change. If you care about climate, these books are “best in class”.
Last Monday (January 4th, 2016), we published a postsummarizing the implications of our critique of Harry Saunders’ article on rebound effects in the US economy. We have since received thoughtful comments from Dr. Saunders (a Senior Fellow at the Breakthrough Institute (BTI)), Jesse Jenkins (a PhD student at MIT and lead author of the 2011 Breakthrough Institute rebound report that relied on Saunders’ article), and Steve Sorrell (Professor at the University of Sussex and a BTI Senior Fellow*).
Here, we address the main objections our critics have raised. We pay special attention to Professor Sorrell’s comments because they have been endorsed by Mr. Jenkins, BTI Chairman Ted Nordhaus, and BTI co-founder and Senior Fellow Michael Shellenberger.
To begin, we note that none of our critics have disputed our core finding: that Dr. Saunders’ analysis relied on national average energy prices, not the sector-specific prices he claimed his data represented. In addition, Dr. Saunders used average annual price data, whereas economists generally prefer marginal prices to properly isolate the rebound effect from unrelated behavioral and energy market-induced changes.
Given the nearly five years it took to prompt a discussion about Dr. Saunders’ evidence, including long conversations over email and in person, the silence on this point is notable. Nevertheless, we take it as a sign that all sides agree on these critical observations, which (as we pointed out in our response paper) have always been confirmable both directly in the data in question and its documentation. There are many more problems to work through, of course, but this is a productive start.
Having at least acknowledged some deficiency in Dr. Saunders’ analysis, then, our critics either implicitly distance their policy positions on the rebound effect from Dr. Saunders’ article and/or defend the econometric analysis of energy price data we have shown to be woefully inadequate. Below, we review these arguments and offer some responses.
Argument 1: Don’t Let the Perfect Be the Enemy of the Good
Scientists don’t always have perfect data and sometimes they need to make assumptions about missing information. That’s fine when done explicitly and accompanied by uncertainty analysis to illuminate how the analyst’s assumptions affect the results. The problem here isn’t that there’s a missing piece of information, however, but rather that the entire data set, because of its limitations, cannot support credible investigation of the research question.
In a comment on earlier post, Professor Sorrell praises Dr. Saunders’ analysis for its nuance, asks what would happen if we had re-run his model with better data, and wonders why we didn’t report any such results:
A commendable feature of [Dr. Saunders’] paper is the 3 pages devoted to listing ‘cautions and limitations’. The potential inaccuracies in energy price data simply adds one point to this list. In the absence of any empirical tests (why not repeat the analysis with the revised data??), you have not demonstrated that the data inaccuracies lead to any systematic bias in the rebound estimates, or that the bias is necessarily upwards rather than downwards. Hence, it is misleading to conclude that the results are 'wholly without support’.
Our response: Professor Sorrell addresses only one of the two major errors we identified in Dr. Saunders’ analysis (data quality). In ignoring the other (data structure), he calls for the impossible.
First, let’s review the structural issue. Again, Dr. Saunders’ data report national average energy prices, not the sector-specific prices he claimed to be using. The idea that this fundamental misunderstanding can be corrected by adding another bullet point to a list of caveats would be an audacious remedy, as we pointed out previously:
Lest this seem like a petty academic grievance, it’s as though Dr. Saunders set out to study the performance of individual NFL quarterbacks when their teams are behind in the third quarter of play, but did so using league-wide quarterback averages across entire games—not third-quarter statistics for each player. If that doesn’t sound credible to sports fans, trust us, it’s an even bigger problem when you’re talking about the last fifty years of U.S. economic history.
If Professor Sorrell only meant to suggest that the data qualityproblems could be addressed with a new caveat, he nevertheless glosses over the structural issues. On their own, the structural issues offer sufficient reason to question Dr. Saunders’ results.
Let us assume that Professor Sorrell is concerned more with the data quality issues we raise. As we discuss at great length in our response article and its supplemental information—have our critics yet digested these documents?—one cannot actually trace the primary source of Dr. Saunders’ data. That should be reason enough to take stock of the reasonableness of their use. If additional reasons are desired, the data documentation includes more than a few heroic (and largely arbitrary) assumptions necessary to fill in gaps in the historical record; a heavily footnoted research trail in our supplemental information provides a map for the interested reader.
Having dug into the details, our view is that one simply can’t treat these energy data as precise for the purposes of econometric modeling of the rebound effect.
Consistent with Professor Sorrell’s suggestion, we would have been be happy to apply Dr. Saunders’ model to a more robust data series, except that (as we once again pointed out in our article) no such data exist: Dr. Saunders’ model requires data at a level of detail that simply is not available in the United States. Reconstructing the data from primary sources or addressing their current validity in light of the lack of primary data sources would take a PhD dissertation, not an extra footnote—if it could even be done at all with the available primary sources, which remains an open question.
To recap, Dr. Saunders mistakenly employed national average energy prices while believing his model was processing sector-specific price data. Moreover, he treated his data as though they were precise, when a closer examination reveals their construction involved several unfounded assumptions and oversimplifications that should undermine confidence in any subsequent econometric analysis. That one cannot trace the data back to its primary sources adds an additional layer of concern for anyone with high standards for data quality. As a result, the data structure and data quality issues are each fundamental problems with the published analysis, not missing entries on a long list of caveats.
Hence, we concluded that Dr. Saunders’ results are wholly without support because his data do not match his model specifications and because the available primary data cannot address the research question at hand.
Argument #2: It’s All About the Variation
Dr. Saunders makes the most direct defense of his paper, arguing that his model accurately captures the essence of the rebound effect despite imperfections in the data:
Not clear that the absolute energy price matters much. Variation is fundamental driver. Historical energy price sets used for econometrics vary by nearly an order of magnitude over the time series, sufficient to tease out production behavior over a wide range of input prices.
The premise here is that other models are successfully calibrated using data featuring levels of variation that are comparable to those found in Dr. Saunders’ own data. Dr. Saunders therefore suggests that his data are sufficient to calibrate the model in a way that allows it to achieve statistical validity.
With respect, we’re not comfortable with the idea that using incorrect absolute energy prices is immaterial to the validity of one’s results. Assuming, however, that for some particular statistical model the variation in energy prices is the only key input variable, Dr. Saunders still hasn’t made a reasonable defense. A data set might contain sufficient variation in order to be sure that a model is exposed to a wide range of input data that covers the relevant analytical space in mathematical terms. But nothing about that statement indicates that the reported variation accurately reflects the actual economic choices the data are supposed to measure.
In other words, there may be sufficient variation in Dr. Saunders’ data to ensure that the model can be calibrated using these data, but that doesn’t say anything about the accuracy of either the data or results. (Or more bluntly: variable garbage in, well-calibrated garbage out.)
We are reluctant to re-hash all of our data concerns here. After all, that’s why we wrote a paper and included a lengthy technical appendix, the substance of which none of our critics has yet addressed. But for the sake of argument, we’ll review two issues here to hammer the point home.
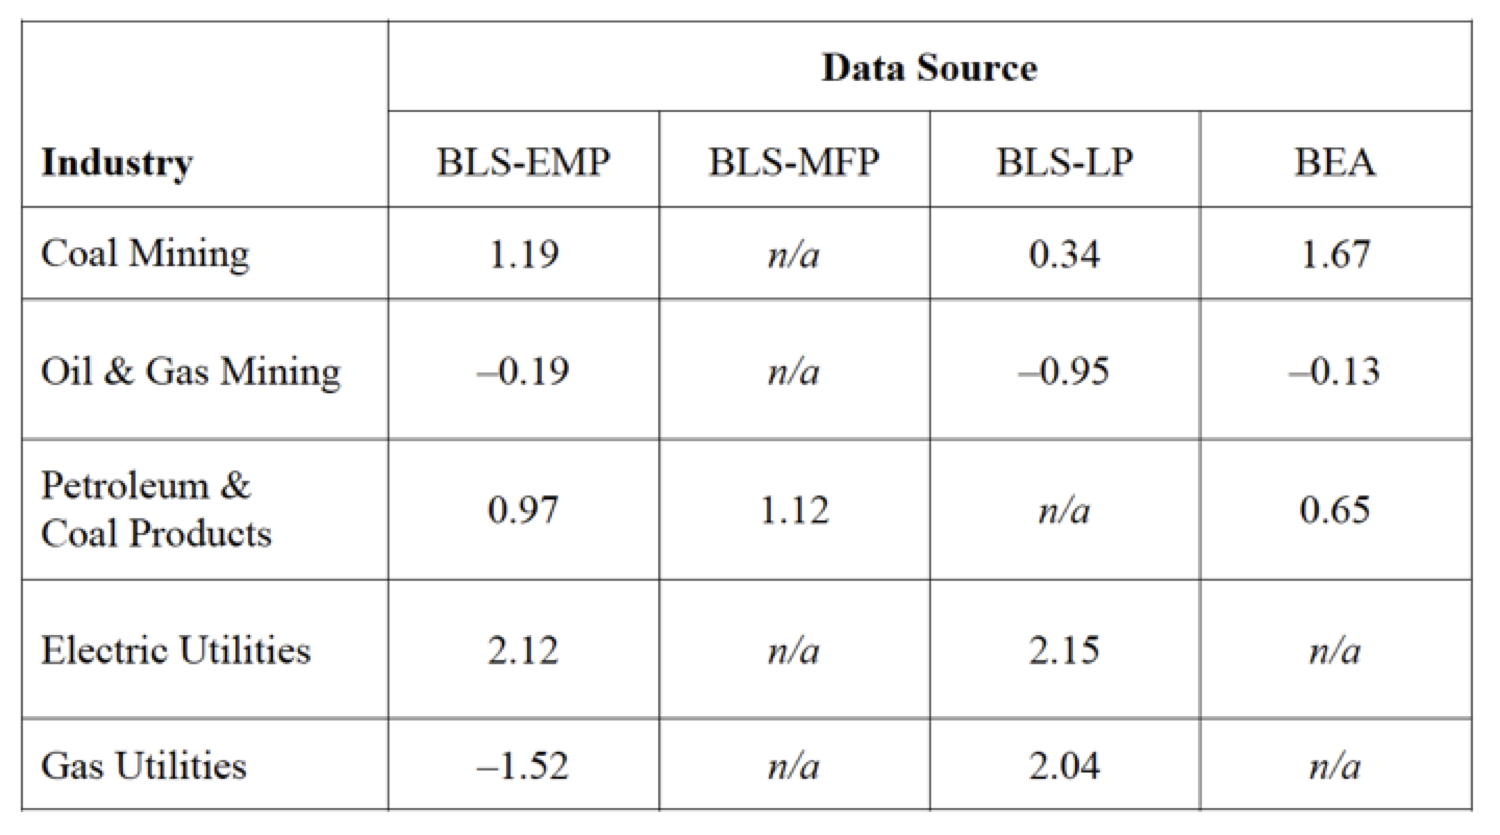
First, in one of the references in Dr. Saunders’ paper (Jorgenson et al., 2005),[1]the authors of Dr. Saunders’ data describe how the selection of different primary data sources would change key parameters in the data set Dr. Saunders used. As we discuss in our response article, the KLEM data are the product of input-output (I–O) tables, which show the annual expenditure flow between each of 35 industries in the accounting system Dr. Saunders employed. In Table 1 below (see Table SI-1 in our appendix), we illustrate how four different primary data sources from the Bureau of Labor Statistics (BLS) and Bureau of Economic Analysis (BEA) report different gross output growth rate statistics for each of the five energy sectors in the KLEM data series (i.e., the “E”). (Professor Jorgenson ultimately selected the BLS-EMP series, though as we discuss in our article’s appendix, BLS no longer publishes these data.)
As Table 1 shows, there is a huge amount of variation across primary data sources—not the good kind, unfortunately, but the type that illustrates how uncertain the selected data are. But the story is even more problematic than that. These statistics are for output growth rates for each of the sectors, not the I–O tables at the core of Professor Jorgenson’s (and hence, Dr. Saunders’) data. Gross output by sector is much easier to estimate than are I–O tables because there are gross outputs for each of n sectors (n=35) while an I–O table is a matrix with n2 entries (35 x 35 = 1225). The best statistical estimates of I–O tables are made in the so-called benchmark economic surveys that BEA conducts once every five years; data for the years in between are extrapolated, not directly observed. So it’s very likely that there is even more variation (and therefore less precision) across primary data sources that attempt to estimate the full I–O matrix.
Table 1: Comparison of average annual growth in gross output by sector and data source (average % growth per year, 1987-2000)
As a final point, Table 1 reports the five industries constituting the “E” in the KLEM data series and in Dr. Saunders’ model; each is represented by a single national average price. Yet most energy economists would not recognize each of the five “E” economic categories as representative of real energy markets or energy prices: for example, our earlier post showed how electric utility rates vary widely by sector and geography, and are not readily related to a single national average. (Again, these are national averages, not marginal prices; marginal prices are the fundamental driver of rebound effects in standard microeconomic theory and differ substantially from average prices in the electric sector.)
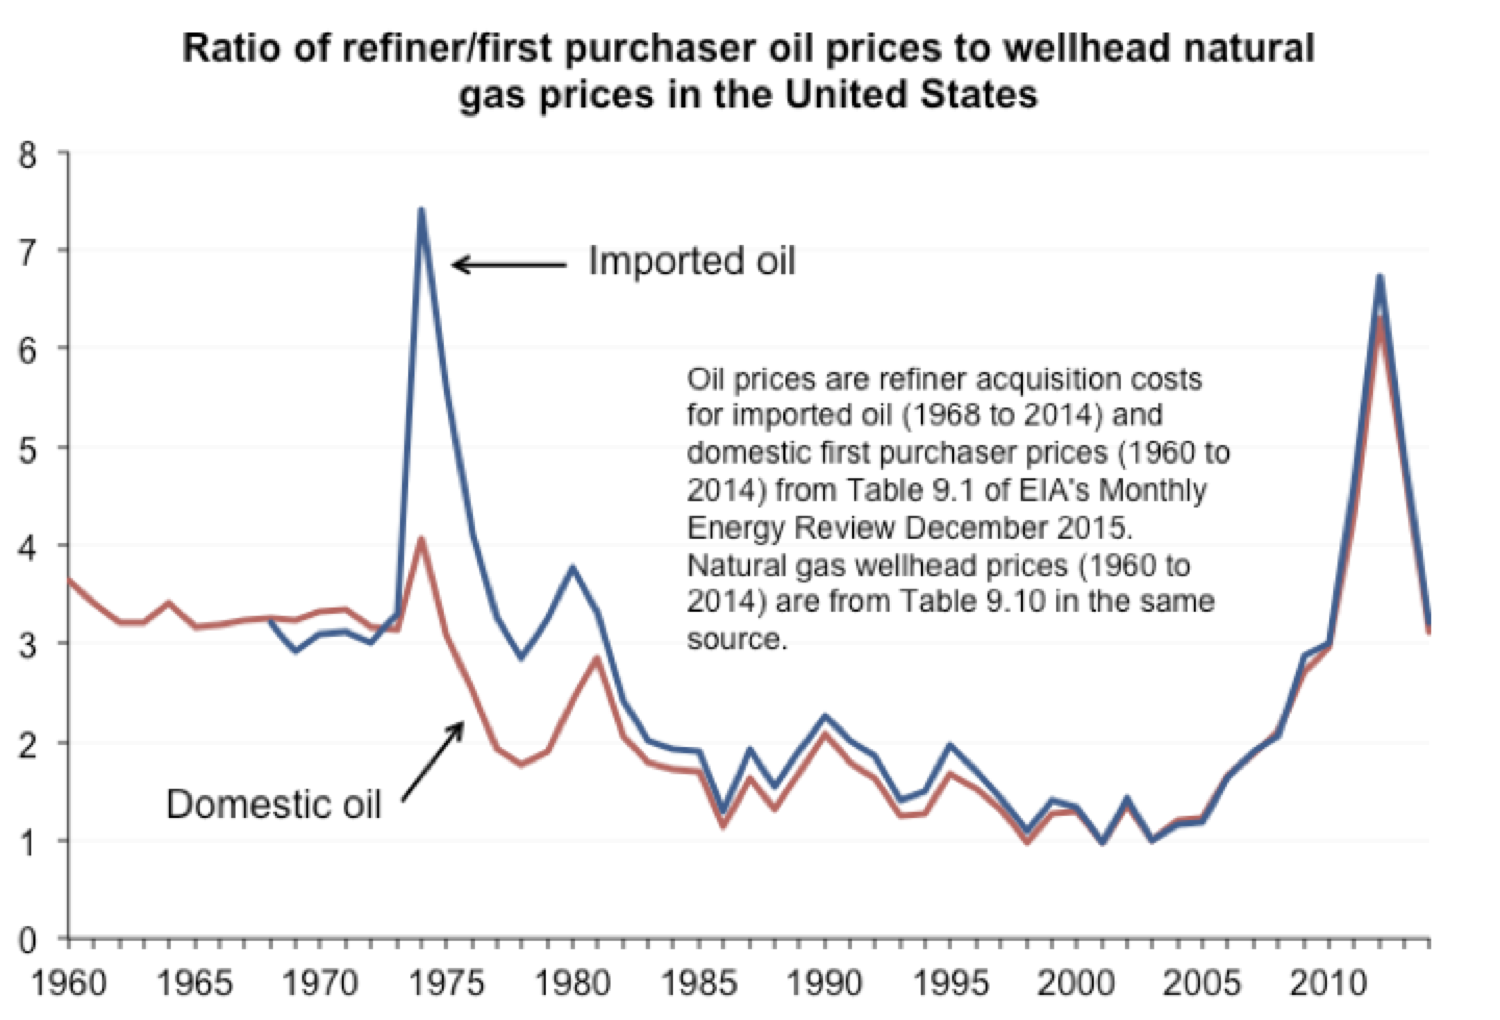
As an additional example, we’d point to the “Oil & Gas Mining” sector, which combines all domestic oil and gas production. In Dr. Saunders’ data, there is a single price signal for consumption of domestic oil and natural gas, two fossil fuel resources that have in reality experienced great and uneven changes over the last 50 years. Below, we use Energy Information Administration data to plot the ratio of oil prices to wellhead natural gas prices as a simple visual measure of how unreasonable that assumption is, given that (1) natural gas and oil often compete with each other and (2) relative prices matter a great deal in determining such choices.[2]
Figure 1: Ratio of oil to natural gas prices
A quick review of the figure shows that oil and natural gas prices do not vary in tandem. Indeed, there are two periods of significant relative price shocks in which oil prices spiked relative to gas prices. Most famously, this occurred during the mid-1970s oil crisis, during which time domestic price controls led to a significant divergence between the price of domestic and imported crude oil. Thus, if a firm had a long-term contract with a domestic oil producer, it faced a substantially different price compared to a competitor who had to buy imports from the global crude market. Subsequently, price controls were lifted and the difference between domestic and imported prices diminished.[3]
As the figure illustrates, nothing about economic history suggests that a composite oil and gas production sector (with one average price series representing both resources) could accurately measure the variation in relative gas and oil prices that actual economic actors have faced since 1960. Yet this assumption is necessary for the I–O structure of Dr. Saunders’ data to function and is therefore an embedded error in his assessment of sector-level rebound effects.
Argument #3: Everyone is Doing It
Another argument suggests that the problems we identify in Dr. Saunders’ article are no more significant than is the norm in acceptable scholarship in this area of research.
Here is Professor Sorrell again:
Your critique over potential inaccuracies in the energy price data could probably be extended to the capital, labour and materials data - where measurement problems are greater. But you would need to be acknowledged [sic] that these issues are not unique to Saunders paper, or to Jorgensen’s huge body of work, but are generic to the majority of work in this area.
Dr. Saunders echoed this view as well:
Your critique would extend to all of Dale Jorgenson’s multiple peer-reviewed energy studies. Doubtful he would see a serious problem.
Our response: The energy data (which were prepared by Harvard Professor Dale Jorgenson) are indeed problematic, no matter the prestige of their users or developers. Dr. Saunders’ initial misunderstanding about the structure of these data is entirely unrelated to Professor Jorgenson’s work and sufficiently problematic on its own, but our concerns about the underlying quality of the data do apply more broadly.
As for the comparison to the other KLEM data categories (capital [K], labor [L], materials [M]), we didn’t do the heavy lifting and so have been careful not to comment on this issue in the article or in our earlier blog post. As outsiders to the field of macroeconomic accounting, our presumption was that experts are engaged in detailed discussions of the uncertainties inherent in these estimates and are attempting to address the associated uncertainties in an academically rigorous way.
However, if Professor Sorrell is correct to suggest that the data for capital, labor, and inter-industry transactions are as bad as they are for energy but are not subject to comprehensive uncertainty analysis, then that should give us all pause. Certainly we can’t imagine using problematic data in our own work. Does anyone think the standard should be lower?
Argument #4: Saunders as Strawman?
Separately, Mr. Jenkins and Mr. Nordhaus also addressed our criticism of the Breakthrough Institute report, which heavily featured Dr. Saunders’ results. They argue that it isn’t fair to impugn the whole BTI report based on issues with, as Mr. Jenkins put it, one of over a hundred references. Mr. Nordhaus even went so far as to say that our criticisms of Saunders’ paper amount to “cherry picking” and “knocking down strawmen” when it comes to BTI’s view of the rebound effect.
We are disappointed in these responses for two reasons.
First, as we documented in our original blog post, Dr. Saunders’ article was the very centerpiece of the 2011 BTI report. Indeed, it provided the sole empirical claim to novelty compared to earlier reviews of rebound by Professor Sorrell, the late Lee Schipper, and others. The BTI authors referred to the Saunders analysis again and again, as we described in our previous post:
In most literature reviews, individual paper results are reported in tables or figures and, where the insights or methods are particularly important, briefly discussed in the main text. In contrast, the Breakthrough Report cites Dr. Saunders’ paper 25 times across 17 pages, with several full-page discussions and a detailed reproduction of its complete results. No other citation received anywhere near this level of attention.
Thus, the notion that this is just one reference out of a hundred is entirely misleading. Dr. Saunders’ attention-grabbing results were what gave the BTI report salience, providing an intellectual platform for the backfire narrative that Mr. Nordhaus and Mr. Shellenberger have since developed at BTI. Without Dr. Saunders’ results the 2011 report would not have been nearly as interesting to the outside world.
Second, it’s not at all clear whether Mr. Jenkins and Mr. Nordhaus stand by the work of their BTI colleague, Dr. Saunders. For example, in his recent posts on Twitter, Mr. Jenkins never opined on the validity of Dr. Saunders’ results, focusing instead on a defense of the 2011 BTI report he authored primarily based on the other references and findings it contained. (Indeed, at times Mr. Jenkins now sounds less like his former BTI colleagues and more like his fellow academic researchers writing on energy efficiency and rebound.)
For his part, Mr. Nordhaus has not offered any specifics regarding Dr. Saunders’ work, other than to endorse Professor Sorrell’s comment and Mr. Jenkins’ tweets.
Perhaps Mr. Jenkins and Mr. Nordhaus wish to clarify their positions on Dr. Saunders’ conclusions. Is the validity of Dr. Saunders’ results relevant to evaluating the 2011 BTI report? If not, why not? And if (as Mr. Jenkins suggests) Dr. Saunders’ analysis isn’t material to the BTI report’s conclusions, why was it featured so heavily before it had been peer reviewed?
Argument #5: The Burden of Proof
Ultimately, the argument over how to adjudicate Dr. Saunders’ article and our response comes down a debate over who bears the burden of proof.
As Dr. Saunders put it:
Of course the analysis stands to be improved by further geographic decomposition for each sector. Even better, firm-by-firm, but … [the] burden of proof rests on any who claim further disaggregation would substantially change results.
Professor Sorrell struck a similar tone:
Saunder’s [sic] aim in setting out the various 'cautions and limitations’ is to “encourage researchers to find ways to overcome them if energy efficiency rebound is to be properly understood”. That is the spirit in which the issue should be approached - improving our understanding of a complex phenomenon through better data and empirical methods. Identifying problems with the energy price series can contribute to that. But only if followed through with a revised analysis that contributes to the growing evidence base. Not as a basis for reinforcing entrenched positions[.]
Both Dr. Saunders and Professor Sorrell get this one backwards. The scientific process is all about evidence. If the evidence turns out to be weak, good scientists revisit their conclusions and revise them accordingly. That standard is all the more important in the social sciences, where human behavior makes for messier data.
We’ve done our best to make a clear case showing how Dr. Saunders’ energy data are severely flawed. Insisting that we go a step further and fix those problems, despite the fact that we’ve identified a lack of primary data necessary to that fix, is asking too much. It is sufficient for us to show that the existing data cannot support the conclusions Dr. Saunders and his BTI colleagues draw. Others can, if they wish, attempt to remedy those problems—but that is neither our job nor a prerequisite for a valid critique.
If anything, Dr. Saunders had an obligation to proactively address the shortcomings we found in his data. As we mentioned in our previous post, we discussed our concerns about data quality with him and Mr. Jenkins over a private lunch in March 2011 and again in June 2011 at a Carnegie Mellon University technical workshop in Washington, DC (PDF slides available here). Yet Dr. Saunders’ published article contains no mention of these issues. Surely timing wasn’t the problem: Technological Forecasting & Social Change reports that the initial manuscript was received in December of 2011; Dr. Saunders later provided a revised manuscript in response to reviewer comments in November 2012, a year and a half after we alerted him to a serious problem. When a researcher forges ahead with an approach that is known to be problematic, he doesn’t have the right to ask his critics to re-do his work for him.
Rather than double down on conclusions not supported by the data, Dr. Saunders and his colleagues should acknowledge the flaws in his analysis and cease relying on it to support any propositions about the rebound effect.
Conclusions
Our critics do not offer substantive defenses of Dr. Saunders’ analytical errors, nor can they explain away the Breakthrough Institute’s rhetorical overreaches in promoting them.
Documenting these problems does not tell us what the true magnitude of the rebound effect is, but it nevertheless offers reason to look elsewhere for that answer in the future. As we made clear in our journal article and earlier blog post, our work doesn’t attempt to estimate the likely range of rebound effects. Instead, we recommended several academic reviews from balanced and well-respected researchers at UC Berkeley, UC Davis, Yale, Carnegie Mellon University, and the Environmental Defense Fund. (Professor Sorrell’s 2007 UKERC review is another useful resource, though we expect he would agree that more contemporary assessments have captured additional studies published in the last ten years.)
In the end, credibility matters in this debate because energy efficiency research requires attention to detail, consistency between empirical evidence and theoretical modeling, and above all a commitment to intellectual integrity. We are sure that researchers like Dr. Saunders, Professor Sorrell, and Mr. Jenkins share these values, although we are equally confident that (1) the evidence does not support Dr. Saunders’ findings and (2) the 2011 BTI report from Mr. Jenkins, Mr. Nordhaus, and Mr. Shellenberger prematurely promoted Dr. Saunders’ results.
Finally, although we don’t seem to find much common ground on the technical issues, we appreciate the collegiality that Dr. Saunders, Mr. Jenkins, and Professor Sorrell have maintained throughout our discussions. It’s easy to let things get out of hand when arguing over contentious policy issues, and we are glad that this group is committed (as are we) to keeping the debate substantive and professional.
Corrigendum
*Our original post stated that Professor Sorrell is a Senior Fellow at Breakthrough Institute. However, Dr. Saunders informs us that Professor Sorrell is not and has never been formally affiliated with BTI. We regret the error and apologize for any confusion.
References
[1] Jorgenson, D., M. Ho, K. Stiroh (2005). Productivity (Volume 3): Information Technology and the American Growth Resurgence. Cambridge, M.A.: The MIT Press (see Table 4-4 on pp. 116-17).
[2] Oil prices are refiner acquisition costs for imported oil (1968 to 2014) and domestic first purchaser prices (1960 to 2014) from Table 9.1 of EIA’s Monthly Energy Review (December 2015). Natural gas wellhead prices (1960 to 2014) are from Table 9.10 in the same source. . Natural gas prices converted from $/cubic foot to $/mmBtu assuming 1029 Btu/cubic foot. Oil prices converted from $/bbl to $/mmBtu using 5.8 mmBtu/bbl.
[3] Although it is not relevant for the period of Dr. Saunders’ study, a similar episode occurred more recently with high world oil prices and abundant (but physically stranded) North American natural gas resources due to fracking. A separate and potentially more relevant episode concerns the domestic natural gas market. The gas market experienced significant regulatory changes over the long period of Dr. Saunders’ study, although the effects are not visible in the simple metric of price ratios we have chosen for the figure. Briefly, natural gas wholesale prices were federally regulated until the mid-1970s, with reforms eventually leading over the next decade or so to market-based wholesale prices based on regulated open-access interstate pipeline networks. During this time, wholesale consumers who signed long-term contracts at regulated prices faced significantly different prices than those who bought wholesale natural gas at market rates. Thus, the marginal price of natural gas industrial consumers experienced varied much more widely than a national average price would suggest.


