Everyone makes mistakes on the rebound

What follows is a joint blog post by Danny Cullenward and Jonathan G. Koomey.  To freely download the journal article in which we dissect the Saunders article on rebound, click here.  Our article will be freely downloadable until January 20, 2016.

________________________________________________________________

Summary:  About once a decade, a slew of popular headlines wrongly claim that energy efficiency doesn’t actually save energy or reduce emissions due to the rebound effect. We describe a recent episode in which headline-grabbing but fatally flawed claims on rebound misled policymakers and researchers.

________________________________________________________________

In February 2011, Jesse Jenkins, Ted Nordhaus, and Michael Shellenberger of the Breakthrough Institute released a widely read report reviewing the academic literature on energy efficiency and the rebound effect. And what, you might ask, is the rebound effect? As the authors put it:

Economists … have long observed that increasing the efficient production and consumption of energy drives a rebound in demand for energy and energy services, potentially resulting in a greater, not less, consumption of energy …. This is known in the energy economics literature as energy demand ‘rebound’ or, when rebound is greater than the initial energy savings, as ‘backfire.’[1]

The big issue here is the extent to which energy efficiency technologies and policies actually reduce energy consumption (and thereby avoid CO2 emissions). If policymakers fail to properly account for rebound effects, they will overestimate the contribution of energy efficiency in their climate strategies—a potentially critical shortcoming, as most climate mitigation efforts rely heavily on energy efficiency in both the developed and developing world.

Given the stakes, it should come as no surprise that a well-written popular literature review on this subject was poised to make headlines (e.g., in The New York Times, Nature, Huffington Post, and Conservation Magazine). All the more so, since the Breakthrough Report made an ostensibly strong case for backfire—the outcome in which efficiency actually causes greater consumption:

This review surveys the literature on rebound and backfire and considers the implications of these effects for climate change mitigation policy…. Rebound effects are real and significant, and combine to drive a total, economy-wide rebound in energy demand with the potential to erode much (and in some cases all) of the reductions in energy consumption expected to arise from below-cost energy efficiency improvements.[2]

In an accompanying blog post, the report’s authors claimed that the “expert consensus and empirical evidence that energy efficiency causes large rebounds and backfire is mostly unknown in the United States,” suggesting that energy efficiency advocates like Amory Lovins have “major media personalities” that block the truth from coming to light. And the truth, Mr. Jenkins wrote, is a sobering thing:

For every two steps forward we take with below cost energy efficiency, rebound effects mean we take one or two steps backwards, sometimes enough to completely erode the initial gains.

On the occasion of the 2014 Nobel Prize in Chemistry being awarded to the inventors of high-efficiency LED lighting technology, Mr. Shellenberger and Mr. Nordhaus criticized the Royal Swedish Academy of Sciences for citing the energy efficiency savings this technology would bring. In a New York Times OpEd, they claimed that:

LED and other ultraefficient lighting technologies are unlikely to reduce global energy consumption or reduce carbon emissions.

This is the stuff of Malcom Gladwell and Freakonomics, not the dry world of academic symposia. According to the Breakthrough Institute, everything you thought you knew about energy efficiency is wrong—and not just wrong, but totally backwards!

A thumb on the scale

If one digs into the 2011 Breakthrough Report, however, it turns out that the support for high rebound and backfire comes not from a systematic survey of a vast set of papers that document these outcomes in practice, but rather from two much more limited sources. One was a set of theoretical modeling studies (i.e., computer exercises, not empirical evidence). The second and most important source was a then-unpublished working paper from Dr. Harry Saunders, a Senior Fellow at the Breakthrough Institute.

Dr. Saunders’ empirical study found high rebound effects and even backfire across multiple industries in the United States. As the Breakthrough Report noted:

While Saunders (2010) is still in review as this paper is written, it represents an important contribution to the study of rebound effects that fills a key void in analysis of rebound for producing sectors of the economy. The paper is therefore included in this review despite its pre publication status.[3]

Reasonable people can debate the merits of including non-peer reviewed work in an authoritative literature review,[4] but Saunders’ report wasn’t merely included in the Breakthrough Report—it was the very centerpiece.

In most literature reviews, individual paper results are reported in tables or figures and, where the insights or methods are particularly important, briefly discussed in the main text. In contrast, the Breakthrough Report cites Dr. Saunders’ paper 25 times across 17 pages, with several full-page discussions and a detailed reproduction of its complete results.[5] No other citation received anywhere near this level of attention.

When the Breakthrough Report was released in early 2011, we expressed concerns over its conclusions, because we harbored serious doubts about the data Dr. Saunders used. Over lunch in Oakland that March, we shared our concerns with Dr. Saunders and Mr. Jenkins (now a PhD student at MIT)—both of whom are unfailingly cordial and professional, despite our differences—but to no avail.

Dr. Saunders insisted his data were of the highest quality, repeatedly invoking the reputation and authority of Professor Dale Jorgenson, the prominent Harvard economist who developed the dataset Dr. Saunders used. But we knew that no primary data were available to provide insights into industry-level prices and consumption data going back to 1960 and were concerned that Dr. Saunders had not appreciated the limitations of his secondary source.

As the rebound debate picked up steam that summer, one of us (D.C.) spoke at a Carnegie Mellon University workshop on the rebound effectand specifically addressed these limitations before a group of energy efficiency experts, including Dr. Saunders and Mr. Jenkins. Neither there, nor at any time since, were they able to explain how their data source obtained regional, industry-level data necessary to estimate the rebound effect by industry over some forty plus years. Yet in the publicity blitz accompanying the Breakthrough Report, not a word was heard about the data quality at the core of Dr. Saunders’ featured results.

Publish first, then peer review

Eventually, Dr. Saunders’ paper was published in the journal Technological Forecasting & Social Change in 2013.[6] Now that his article is in the peer-reviewed literature, official scientific reviews—such as the Intergovernmental Panel on Climate Change (IPCC)—must consider Dr. Saunders’ results, and therefore we felt compelled to formally document our findings. The same journal recently published our response article.[7]

Our work confirms that Dr. Saunders’ data actually concern national average prices, not the sector- and location-specific marginal prices that energy economists agree are necessary to evaluate the rebound effect. The distinction is most important because actual energy prices vary widely by sector and location; in addition, economic theory asserts that changes in the marginal (not the average) price of energy services cause the rebound effect. As a result, Dr. Saunders’ findings of high rebound and backfire are wholly without support.

image
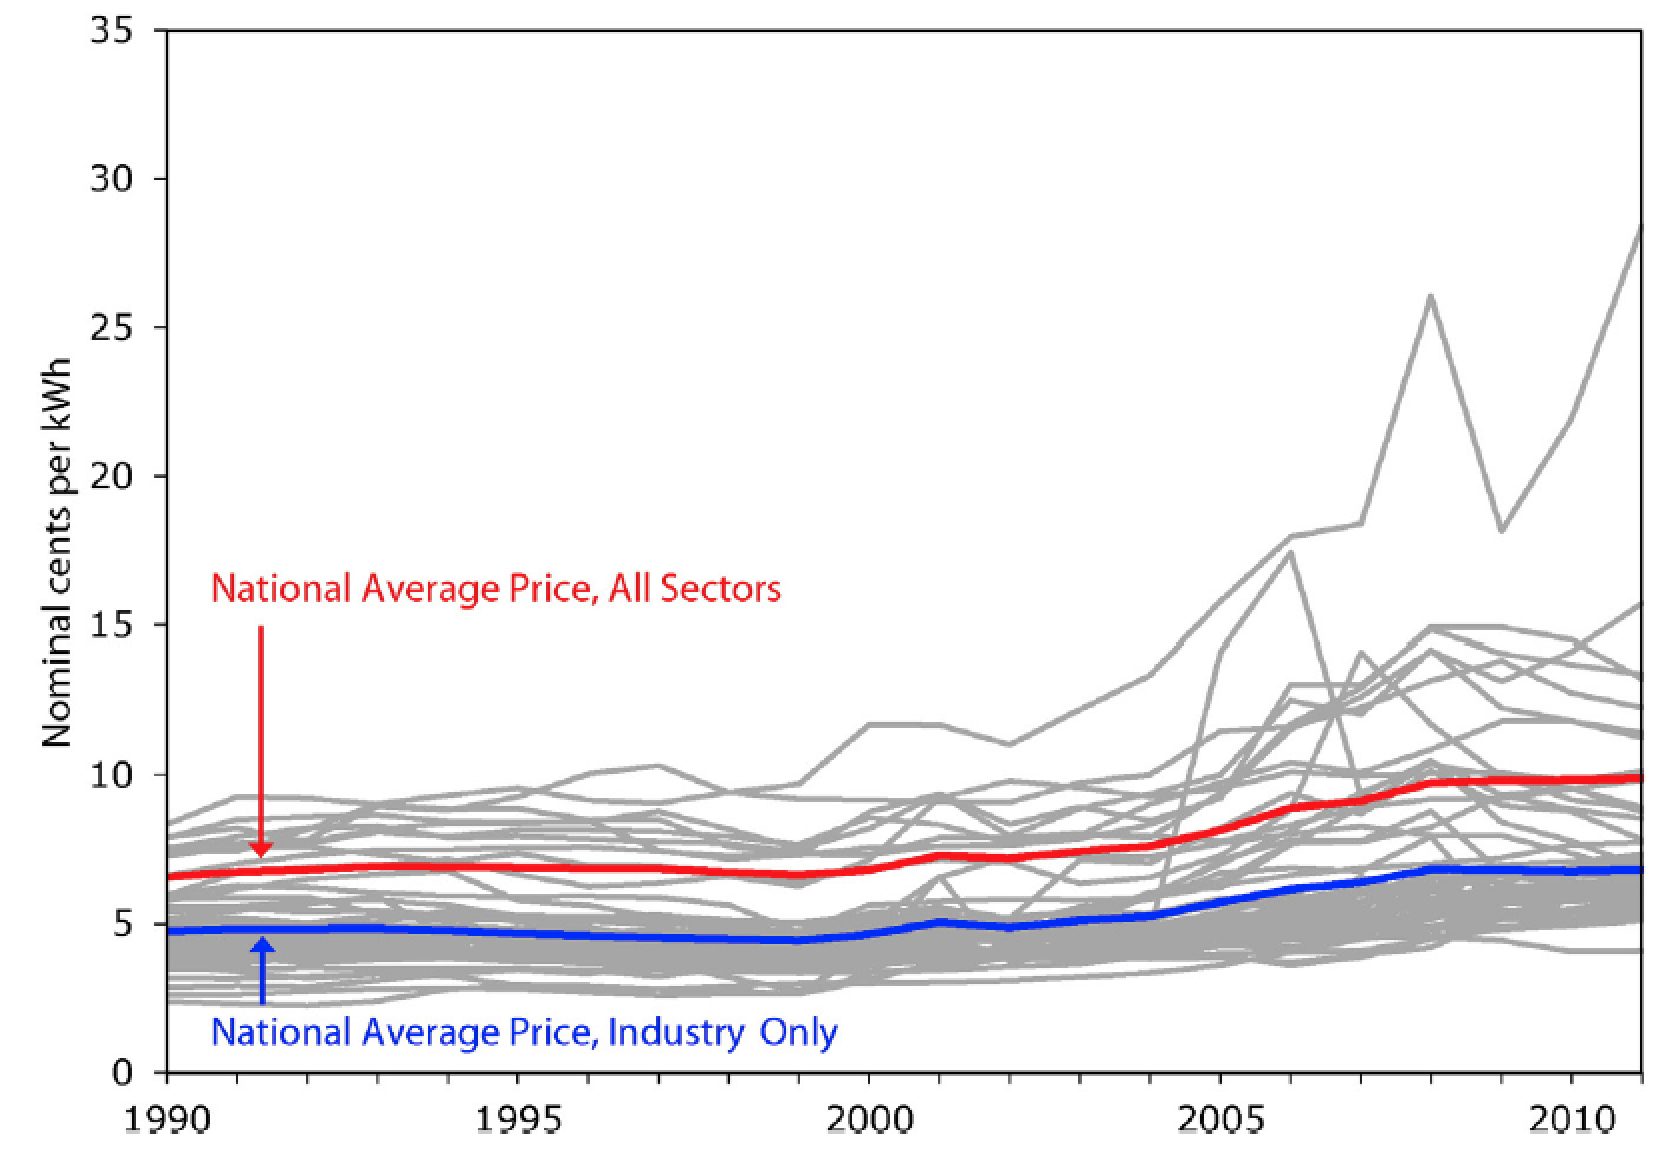
Fig. 8 from Cullenward and Koomey 2016. Industrial electricity prices by state (EIA data). This figure illustrates the variation in average annual electricity prices by state—this time, in the industrial sector. The fact that industrial prices are typically much lower than the average electricity price suggests that the use of national average prices significantly distorts the price signal facing most industrial customers. Each gray line represents the average annual price of electricity in one of the 50 states. The blue line is the average price for electricity in the industrial sector across the United States. The red line is the average price for electricity across all sectors in the United States. (For interpretation of the references to color in this figure legend, the reader is referred to the web version of this article.) And yes, we know that it’s generally better to plot inflation adjusted prices, but because the underlying data in the Jorgenson data is in nominal dollars, we continue to use that convention in our article.

Lest this seem like a petty academic grievance, it’s as though Dr. Saunders set out to study the performance of individual NFL quarterbacks when their teams are behind in the third quarter of play, but did so using league-wide quarterback averages across entire games—not third-quarter statistics for each player. If that doesn’t sound credible to sports fans, trust us, it’s an even bigger problem when you’re talking about the last fifty years of U.S. economic history.

In addition, we showed how the data set Dr. Saunders used is an incompletely documented amalgamation of sources that are no longer publicly available. The U.S. government stopped publishing the primary sources that Professor Jorgenson originally used to create his data set; and on top of that, his reported energy prices are inconsistent with current government energy data. Professor Jorgenson’s efforts may reflect the best attempt to reconcile a messy historical record, but data of this quality must be carefully examined in secondary studies like Dr. Saunders’, not treated as a perfectly reliable primary source with several decimal points’ worth of precision.

Whatever one makes of the limitations of these data, it is important to note that the debate between experts—an admittedly dry process that might not interest many readers—occurred after the Breakthrough Institute represented Dr. Saunders’ results as the new gospel on rebound. This is the opposite of the way the scientific process is supposed to work. Even though we shared our concerns with Dr. Saunders in the spring and summer of 2011, he did not even mention them in his published paper, which he submitted for peer review that December.

As an all-too-common result, the normal mechanisms of peer review and expert feedback played a diminished role after the media blitz of a counter-intuitive narrative on energy efficiency took its toll.

Lessons for the future

Savvy readers won’t be surprised that bold claims on rebound and backfire led to impressive media coverage. In order to justify its position, however, the Breakthrough Institute relied on a then-unpublished working paper that purported to upend the expert consensus on energy efficiency. It is now clear that Dr. Saunders’ conclusions were based on a critically flawed analysis.

Avoiding similar problems in the future requires more engagement between the scientific community and journalists. In particular, science communicators need to take time to confirm they have a new angle on an old story. Like many other issues in environmental policy, the rebound effect has a long history, with debates flaring up every ten years or so.[8]It is entirely possible that new evidence emerges to challenge the conventional wisdom, but journalists should be skeptical of counterintuitive findings that haven’t been vetted within the relevant expert communities.

When a bold new idea is ready for prime time, we are confident its proponents will be able to point to clear and convincing empirical evidence that illustrates well-defined causal mechanisms behind the novel findings.

Nevertheless, in some cases, the academic peer review process may prove too slow to showcase truly exceptional and time-sensitive developments. In these uncommon instances journalists should be particularly careful with technical claims made outside of the peer review process, however, and seek critical views from experts within the scientific community to vet and then comment on any stories deemed credible by that community. We aren’t suggesting that scientists should have the exclusive right to talk about technically complex policy matters, but nor should groups other than those experts dominate the narrative on issues with a rich scientific history.

So what should readers make of the rebound effect? In our view, energy economists agree that (1) backfire is exceedingly rare, and (2) the rebound effect, while important in some cases, is unlikely to offset the majority of expected savings.[9]We also welcome more research on energy efficiency policy and the rebound effect, particularly in emerging economies, where the issue has received less attention thus far.

And while the Breakthrough Institute is right to criticize those who push policymakers to completely ignore the rebound effect, their argument that energy efficiency fails to reduce energy consumption and carbon emissions is simply wrong. It’s time to move on.

About the authors

Danny Cullenward conducted this research during a Philomathia Research Fellowship at the University of California, Berkeley, where he taught climate law and policy. An energy economist and lawyer by training, his work focuses on the design and implementation of science-based climate policy.

Jonathan Koomey is a Research Fellow at the Steyer-Taylor Center for Energy Policy and Finance at Stanford University, worked for more than two decades at Lawrence Berkeley National Laboratory, and has been a visiting professor at Stanford, Yale, and UC Berkeley.

Notes

[1]    Jesse Jenkins, Ted Nordhaus, and Michael Shellenberger, Energy Emergence: Rebound & Backfire as Emergent Phenomena. Breakthrough Institute Report (February 2011), page 4.

[2]    Jenkins et al. (2011), page 4.

[3]    Jenkins et al. (2011), page 16, footnote 13.

[4]    Including within the Breakthrough Institute, it seems: BTI Senior Fellow Roger Pielke, Jr. strongly criticized the IPCC in 2009 for “laundering” non-peer reviewed findings into its high-profile climate science reports.

[5]    We count citations by the number of paragraphs that specifically reference Dr. Saunders’ white paper, excluding multiple mentions within a single paragraph so as to conservatively assess its prominence in the Breakthrough Report. Dr. Saunders’ paper is discussed at length on pages 16-19 and 30-32, including a full page of results presented on page 18.

[6]    Harry D. Saunders (2013), Historical evidence for energy efficiency rebound in 30 US sectors and a toolkit for rebound analysis. Technological Forecasting & Social Change 80(7): 1317-1330.

[7]    Danny Cullenward and Jonathan G. Koomey (2016), A critique of Saunders’ ‘Historical evidence for energy efficiency rebound in 30 US sectors’, Technological Forecasting & Social Change 103: 203-213 (2016).

[8]    See, for example, Daniel J. Khazzoom (1980), Economic implications for mandated efficiency in standards for household appliances. The Energy Journal 1: 21-40; John Henly, Henry Ruderman, and Mark D. Levine (1988), Energy Saving Resulting from the Adoption of More Efficient Appliances: A Follow-up. The Energy Journal 9(2): 163-170; Len Brookes (1990), The greenhouse effect: the fallacies in the energy efficiency solution. Energy Policy 18(2): 199-201; Lee Schipper (2000), On the rebound: the interaction of energy efficiency, energy use, and economic activity. Energy Policy 28(6-7): 351-353 (an entire special journal issue dedicated to the rebound effect); Steven Sorrell (2007), The Rebound Effect: an assessment of the evidence for economy-wide energy savings from improved energy efficiency. UK Energy Research Center Report.

[9]    For a deeper treatment of the rebound issue, we recommend: Inês Azevedo (2014), Consumer End-Use Energy Efficiency and Rebound Effects. Annual Review of Environment and Resources 39: 393-418; Severin Borenstein (2015), A Microeconomic Framework for Evaluating Energy Efficiency Rebound And Some Implications. The Energy Journal36(1): 1-21; Kenneth Gillingham, David Rapson, and Gernot Wagner (2016), The rebound effect and energy efficiency policy. Review of Environmental Economics and Policy, forthcoming.

Our article on electricity demand and GDP is now out in the Electricity Journal, and is free to download until Jan 3, 2016!

image

My colleague Richard Hirsh and I just published our article in The Electricity Journal titled “Electricity Consumption and Economic Growth: A New Relationship with Significant Consequences?”.  The Electricity Journal.  vol. 28, no. 9. November 2015. pp. 72-84. [http://www.sciencedirect.com/science/article/pii/S1040619015002067]

The data tell an interesting story.  The decoupling of energy and GDP that happened in the US starting in the 1970s has been followed, a couple of decades later, by decoupling of electricity and GDP.  We explore some possible explanations for this new development in the article.

Until January 3, 2016, you can download the article for free (please let me know if you have any issues downloading it).  Also email me if you’d like the spreadsheet with all the data and analysis.

Here’s a summary of the article:

The growth rate of electricity consumption has important implications for business and public policy.   Increasing use usually boosts electric utilities’ profits, but construction of new power plants to meet that demand may add to managerial and environmental woes. The traditional electric utility business model is predicated on continuing growth in consumption, and if the rate of growth slows (or becomes negative) profits will decline, especially if companies build unneeded generating plants.  

This article describes altered trends in the relationship between growth in economic activity and electricity use and offers hypotheses for the changes, focusing on government policy, the changing structure of the American economy, increasing use of information and communication technologies, higher prices for power, and measurement biases.

From the early 1970s to the mid-1990s, electricity demand grew in lockstep with GDP, so that a 1% increase in economic activity implied a 1% surge in electricity use.  But after 1996, the electricity intensity (electricity use per inflation-adjusted dollar of GDP) of the US economy began declining.  Surprisingly, since 2007, electricity demand growth has been roughly flat, in spite of an 8% increase in real GDP, a situation that may presage a new phase of decoupling.  The altered relationship between electricity consumption and economic growth requires all stakeholders in the utility system to rethink old assumptions and prepare for what appears to be the new reality of lower growth rates in electricity consumption.

Read more…

Prepare for new Scope 2 emissions reporting requirements with this upcoming free webinar

image

On October 13, 2015 at 9am PDT, Anthesis Group and World Resources Institute are partnering to bring you an informative free webinar on the new Scope 2 emissions reporting protocol from WRI’s Greenhouse Gas Protocol Team.

Here are the details:

The webinar will review the details adopted in the new WRI GHGP scope 2 guidance which requires a dual approach for reporting scope 2 GHG emissions and creates new accounting challenges and opportunities for reporting companies.

Date: Tuesday, October 13th 2015

Time: 9am PDT/ 12pm EDT

Link to registration page:      https://attendee.gotowebinar.com/register/8709321033009947905

Anthesis & WRI will be offering a detailed presentation on the accounting principles set out in the new guidance, a step-by-step walk through of worked examples to illustrate the dual approach in practice, a discussion on how to collect and manage new sets of emissions factors, and a sure to be lively Q&A.  Refer to our previous posts on this subject to get up to speed on these changes and learn more.

Both teams are top notch, and the subtleties of these reporting protocols are important for corporate sustainability folks to understand.

Addendum: For those who aren’t up on the definitions of scope 1, 2, and 3 emissions, here’s what the GHG protocol site says:

The GHG Protocol defines direct and indirect emissions as follows:
Direct GHG emissions are emissions from sources that are owned or controlled by the reporting entity.
Indirect GHG emissions are emissions that are a consequence of the activities of the reporting entity, but occur at sources owned or controlled by another entity.

The GHG Protocol further categorizes these direct and indirect emissions into three broad scopes:

Scope 1: All direct GHG emissions.
Scope 2: Indirect GHG emissions from consumption of purchased electricity, heat or steam.
Scope 3: Other indirect emissions, such as the extraction and production of purchased materials and fuels, transport-related activities in vehicles not owned or controlled by the reporting entity, electricity-related activities (e.g. T&D losses) not covered in Scope 2, outsourced activities, waste disposal, etc.

Calling clean energy innovators (especially rock star women entrepreneurs): Cyclotron Road cohort applications are now open

Cyclotron Road is building a new model to advance breakthrough energy technologies. Our purpose: support critical technology development for your project while helping you identify the most suitable business models, partners, and financing mechanisms for long term impact.

By joining Cyclotron Road, innovators receive a salary and seed funding, support from Lawrence Berkeley National Lab facilities and experts, targeted help with critical technology and manufacturing challenges, and connections to a deep network of academics, engineers, entrepreneurs, and industry experts who serve as mentors, collaborators, and commercial partners.

The application for Cyclotron Road’s second cohort is now open. They’re looking for the best, brightest, most driven energy innovators to join the second cohort. Visit cyclotronroad.org/apply to learn more.

Acceptance into the program offers:

• A personal stipend, travel allowance, and health benefits for up to two years
• Lab space & technical collaboration support from Berkeley Lab experts and facilities
• Cyclotron Road programming and mentorship

Application period closes on October 21st, 2015, so act fast!

A highly political example of lying with charts

image

At hearings yesterday about Planned Parenthood, Rep. Jason Chaffetz (R-UT) put up the chart above.  This tweet gives the apparent source of the graph, which is an anti-abortion organization.  Abortion is of course a highly charged issue, and feelings run high, but there is no excuse for making a chart that misleads so blatantly.  Whoever made the graph just superimposed two different graphs with different Y axes, making it quantitatively meaningless and highly misleading.

As Timothy B. Lee at Vox pointed out, the correct way to make such a graph is here:

image

The 2nd graph tells a very different (and accurate) story.  Shame on whoever made the first graph, and shame on Representative Chaffetz for using it.  That’s lying with graphs in a truly blatant manner.

Here’s the old classic book on this topic: How to Lie with Statistics

Also see two more recent resources, my own book Turning Numbers into Knowledge and Stephen Few’s book Show Me the Numbers.

Update:  Blogger Brainwrap at Daily Kos posted a different version of the graph that gives additional context, adding up all the various procedures performed by Planned Parenthood.

Upcoming class: Modernizing enterprise data centers for fun and profit

jgkoomey:

image


Cern datacenter
Photo credit: By Hugovanmeijeren (Own work) [GFDL or CC-BY-SA-3.0-2.5-2.0-1.0], via Wikimedia Commons

I’ve been struggling for years to convince executives in large enterprises to fix the incentive, reporting, and other structural problems in data centers.  The folks in the data center know that there are issues (like having separate budgets for IT and facilities) but fixing those problems is “above their pay grade”.  That’s why we’ve been studying the clever things eBay has done to change their organization to take maximal advantage of IT, as summarized in this case study from 2013:
Schuetz, Nicole, Anna Kovaleva, and Jonathan Koomey. 2013. eBay: A Case Study of Organizational Change Underlying Technical Infrastructure Optimization. Stanford, CA: Steyer-Taylor Center for Energy Policy and Finance, Stanford University.  September 26.
That’s also why I’ve worked with Heatspring and Data Center Dynamics to develop the following online course, which starts October 5th and goes until November 13th, 2015:
Modernizing enterprise data centers for fun and profit  
I also wrote an article for the September 2015 issue of DCD focus with the same name, which describes the rationale for the class.
Here’s the course description:
This is a unique opportunity to spend seven weeks learning from Jonathan Koomey, a Research Fellow at the Steyer-Taylor Center for Energy Policy and Finance at Stanford University, and one of the foremost international experts on data center energy use, efficiency, organization, and management.
This course provides a road map for managers, directors, and senior directors in Technology Business Management (TBM), drawing upon real-world experiences from industry-leading companies like eBay and Google. The course is designed to help transform enterprise IT into a cost-reducing profit center by mapping the costs and performance of IT in terms of business KPIs.
Executives in this course will gain access to templates and best practices used by leaders in your data center. You’ll use these templates to complete a Capstone Project, in which you will propose management changes for your organization to help increase business agility, reduce costs, and move their internal IT organization from being a cost center to a profit center.
I’m excited about this class, but we need more signups by early October. Please spread the word by sending this blog post to upper level management in the company where you work.
Sign up, or find out more…

Class starts Monday!  Sign up soon.

Attack of the zombie servers!

Image:  Critical data centre at University of Hertford. Licensed under a Creative Commons Attribution Share-Alike Unported 3.0 license.

The Wall Street Journal today has an article by Bob McMillan highlighting my work with Anthesis and TSO Logic on zombie servers (those that are using electricity but delivering no useful computing services).  To download our most recent report on the topic, go here.

Here are the first few paragraphs:

There are zombies lurking in data centers around the world.

They’re servers—millions of them, by one estimate—sucking up lots of power while doing nothing. It is a lurking environmental problem that doesn’t get much discussion outside of the close-knit community of data-center operators and server-room geeks.

The problem is openly acknowledged by many who have spent time in a data center: Most companies are far better at getting servers up and running than they are at figuring out when to pull the plug, says Paul Nally, principal of his own consulting company, Bruscar Technologies LLC, and a data-center operations executive with experience in the financial-services industry. “Things that should be turned off over time are not,” he says. “And unfortunately the longer they linger there, the worse the problem becomes.”

Mr. Nally once audited a data center that had more than 1,000 servers that were powered on but not identifiable on the network. They hadn’t even been configured with domain-name-system software—the Internet’s equivalent of a telephone number. “They would have never been found by any other methodology other than walking around with a clipboard,” Mr. Nally says.

Read more (subscription required)…

I’m hopeful that increased attention to this issue will result in more management focus and better application of computing resources to solve business problems.  That’s one reason why I’m teaching my upcoming online class (October 5 to November 13, 2015) titled Modernizing enterprise data centers for fun and profit.  Also see my recent article in DCD Focus with the same title.

My article in DCD Focus this month:  Modernizing enterprise data centers for fun and profit

image

Data Center Dynamics just published my article titled “Modernizing enterprise data centers for fun and profit”, which describes the rationale for my upcoming online class.  That class starts October 5, 2015.

Here are the opening paragraphs:

Twenty first century data centers are the crown jewels of global business. No modern company can run without them, and they deliver business value vastly exceeding their costs. The big hyperscale computing companies (like Google, Microsoft, Amazon, and Facebook) are the best in the industry at extracting that business value, but for many enterprises whose primary business is not computing, the story is more complicated.

If you work in such a company, you know that data centers are often strikingly inefficient. While they may still be profitable, their performance still falls far short of what is possible. And by “far short” I don’t mean by 10 or 20 percent, I mean by a factor of ten or more.

Read more…

The course will teach people how to bring their data centers into the twenty first century, turning them from cost centers into cost-reducing profit centers.

Sign up here!

Upcoming class: Modernizing enterprise data centers for fun and profit

image

Cern datacenter
Photo credit: By Hugovanmeijeren (Own work) [GFDL or CC-BY-SA-3.0-2.5-2.0-1.0], via Wikimedia Commons

I’ve been struggling for years to convince executives in large enterprises to fix the incentive, reporting, and other structural problems in data centers.  The folks in the data center know that there are issues (like having separate budgets for IT and facilities) but fixing those problems is “above their pay grade”.  That’s why we’ve been studying the clever things eBay has done to change their organization to take maximal advantage of IT, as summarized in this case study from 2013:

Schuetz, Nicole, Anna Kovaleva, and Jonathan Koomey. 2013. eBay: A Case Study of Organizational Change Underlying Technical Infrastructure Optimization. Stanford, CA: Steyer-Taylor Center for Energy Policy and Finance, Stanford University.  September 26.

That’s also why I’ve worked with Heatspring and Data Center Dynamics to develop the following online course, which starts October 5th and goes until November 13th, 2015:

Modernizing enterprise data centers for fun and profit  

I also wrote an article for the September 2015 issue of DCD focus with the same name, which describes the rationale for the class.

Here’s the course description:

This is a unique opportunity to spend seven weeks learning from Jonathan Koomey, a Research Fellow at the Steyer-Taylor Center for Energy Policy and Finance at Stanford University, and one of the foremost international experts on data center energy use, efficiency, organization, and management.

This course provides a road map for managers, directors, and senior directors in Technology Business Management (TBM), drawing upon real-world experiences from industry-leading companies like eBay and Google. The course is designed to help transform enterprise IT into a cost-reducing profit center by mapping the costs and performance of IT in terms of business KPIs.

Executives in this course will gain access to templates and best practices used by leaders in your data center. You’ll use these templates to complete a Capstone Project, in which you will propose management changes for your organization to help increase business agility, reduce costs, and move their internal IT organization from being a cost center to a profit center.

I’m excited about this class, but we need more signups by early October. Please spread the word by sending this blog post to upper level management in the company where you work.

Sign up, or find out more…

My colleagues and I just did an “Ask Me Anything” on Reddit, focusing on our Oil Climate Index

This morning we did an AMA (Ask Me Anything) on Reddit, focusing on our Oil Climate Index (OCI) and the related interactive web tool.   I hadn’t done one of these before, and I was pleasantly surprised at how well it turned out (go here to take a look).  Anyone can ask questions and we got to answer them.  The questions and answers remain up for others to examine after the AMA is done.  Some questions were a bit far afield, but there were also many excellent ones.  For those interested in the OCI, it’s a good place to learn more.

Read more…

A useful infographic for our Oil Climate Index

The team at Carnegie just created a useful infographic for our Oil-Climate Index and the accompanying OCI web tool.  I’m often skeptical of infographics, because they can be oversimplified, but this one seems to capture the essence of our work without doing violence to accuracy.  Please let me know if you agree!

Our latest research on comatose servers

image

I’ve been working with Jon Taylor of Anthesis Group and Aaron Rallo of TSO Logic to compile data on servers in enterprises that are using electricity but generating no useful computing output (we call these comatose servers).  Until now, it has been difficult to compile data on idle servers over the network, but recent developments in measurement of server utilization and network data flows allow us finally to identify these servers in an automated way.

The Uptime Institute and McKinsey and Company had earlier estimated that up to 30% of servers in many data centers were comatose, and new data from TSO Logic confirms these estimates. Our initial sample size is small (4000 servers) but the data show that 30% of the servers in this sample hadn’t been used in more than six months.

If this finding holds up for larger sample sizes (and we expect it will) then about 10 million servers in the world are comatose, stranding tens of billions of dollars of data center capital and wasting billions every year in operating cost and software license costs.

In the twenty first century, every company is an IT company, but too many enterprises settle for vast inefficiencies in their IT infrastructure. The existence of so many comatose servers is a clear indication that the ways IT resources in enterprises are designed, built, provisioned, and operated need to change. The needed changes are not primarily technical, but revolve instead around management practices, information flows, and incentives. To learn how to implement such changes, see my Fall 2015 online class titled Management Essentials for Transforming Enterprise IT.

We will update the analysis as the data set grows, with the next update due in Fall 2015.

Read more…

Updates

Forbes posted a nice summary of our work, giving some important context.

TSO logic did a blog post with more information.

Data Center Knowledge posted an article summarizing the management implications of our findings.

Computer Business Review did a summary article on our work.

Silicon Angle, a technology business publication, wrote a summary June 5, 2015.

Tech Republic summarized our findings and brought in other related efforts.

eWeek (June 15, 2015) summarized our work.

I had a nice chat with Patrick Thibodeau of Computer World, who wrote it all up here on June 19, 2015.

Useful discussion here from readers of The Hacker News.com

Information Week weighed in on WHY such inefficiencies persist in data centers after all these years, using our study as a jumping off point.

CIO magazine also summarized the research on August 17th, 2015, and explained what you can do about it in your data center.

Carnegie’s Oil-Climate Index web tool is now live

I’ve been working for the past couple of years with Deborah Gordon of Carnegie, Adam Brandt of Stanford, and Joule Bergeson of the University of Calgary, on open source data and tools to assess the life cycle greenhouse gas (GHG) emissions of different oils, summarizing them in our Oil-Climate Index (OCI).  Total GHG emissions, when you correctly analyze how oil is extracted, how it’s processed, how it’s transported, and how it’s used, vary by a surprising amount.  The highest emissions oil in our initial sample of thirty global oils has 80% higher emissions than the lowest emissions oil, and that surprising variation is big enough to matter.

Carnegie has just released the online web tool for the OCI, so you can explore the data.  It’s beautifully designed, and the web developers did a terrific job.  There are also mobile versions.  We’ll keep the tool updated as we expand the OCI to more oils.  We expect to have 20 more oils analyzed by the end of this summer.

Please let us know what you think!

See also Presidential Science Advisor John Holdren’s talk at the event introducing the Oil Climate Index, March 10, 2015.

The feasibility of meeting the 2 C warming limit

Dave Roberts of Vox recently posted an article about the climate problem titled “The awful truth about climate change no one wants to admit”, the point of which he summarizes as “barring miracles, humanity is in for some awful shit.”  This conclusion is true even if we manage to keep warming to 2C or below, but even more true if we don’t.

In support of this point of view, Roberts cites analysis showing the increasing difficulty of meeting the 2 C warming limit with every year of delay.  This phenomenon is well known to people who understand the warming limit framing, but it can’t be repeated enough.  Delay makes solving the problem more costly and difficult, a fact that is summarized in the graph below.

image

Source:  Robbie Andrew

Unfortunately, this article falls prey to a particularly common pitfall, that of assuming that we can accurately assess feasibility decades hence.  This mistake is particularly problematic for assessments of political feasibility, because political reality can be remade literally overnight by pivotal events.

Here’s how I summarized the problem in Cold Cash, Cool Climate:  Science-based Advice for Ecological Entrepreneurs:

Analysts always impose their ideas of what is possible on which policies and technologies are analyzed, but as I’ll argue in the next chapter, with few exceptions it is very difficult to predict years in advance what is feasible and what isn’t.    People also usually underestimate the rate and scope of change that can occur with determined effort, and this bias is reinforced by the use of models that ignore important effects (like increasing returns to scale and other sources of path dependence), and include rigidities that don’t exist in the real economy (like assuming that individual and institutional decision making will be just like that in the past, even in a future that is drastically different).[1]   For all these reasons, it is a mistake to rely too heavily on models of economic systems to constrain our thinking about the future.  

And it is not just the creators of complex economic models who fall prey to this pitfall.  Rob Socolow, one of the pioneers of the wedges method, was quoted in an article looking back on the contribution of his efforts as saying “I said hundreds of times the world should be very pleased with itself if the amount of emissions was the same in 50 years as it is today.”[2]  Now I’m a big fan of Rob, we’ve been colleagues for years, and I have great admiration for what the wedges papers contributed to advancing the climate debate. But this statement has always rubbed me the wrong way, and I finally figured out why:  it imposes his informal judgment about what is feasible on the analysis of the problem, and as I discuss in the next chapter, that is almost impossible to determine in advance.

Feasibility depends on context, and on what we are willing to pay to minimize risks.  What if there’s a big climate-related disaster and we finally decide that it’s a real emergency (like World War II)?  In that case we’d make every effort to fix the problem, and what would be possible then is far beyond what we could imagine today. It is therefore a mistake for analysts to impose an informal feasibility judgment when considering a problem like this one, and instead we should aim for what we think is the best outcome from a risk minimization perspective, and if we don’t quite get there, then we’ll have to deal with the consequences.  But if we aim too low, we might miss possibilities that we’d otherwise be able to capture.

Judging feasibility without careful analysis really is a distraction–people obsessed with what is possible politically or practically kill innovative thinking because they miss the many degrees of freedom that we have to shape the future.  They take the system as it is for granted, and we just can’t do that anymore.

An archetypal example is the discussion about integrating intermittent renewable power generation (like wind generation or solar photovoltaics) into the grid.  In the old days the grizzled utility guys would say things like “maybe you can have a few percent of those resources on the grid, but above that you’ll destabilize the system”.  Now we know that’s nonsense, and the “conventional wisdom percentage” of what’s allowable has crept up over the years, but it always reflected a static (and incomplete) view of what the system could handle.  Over time, we can even change the system to use smaller gas-fired power plants that respond more rapidly to changes in loads, install better grid controls, institute variable pricing using smart meters, use weather forecasting, and create better software for anticipating grid problems.  All of those things together should allow us to handle much more intermittency than what a conventional utility operator might think is feasible.  And as we become smarter about energy storage, things will get easier still.[3]

The same lesson applies to any attempts to envision a vastly different energy system than the one we have today.  We need to take off our feasibility blinders and shoot for the lowest emissions systems we can create.  That doesn’t mean we can ignore real constraints, but we do need to throw off the illusory ones that are an artifact of our limited foresight. And if we don’t quite make it, that’s life, but at least it won’t be for lack of trying.

Context matters, and what seems infeasible today based on judgments about political will can become feasible tomorrow.  Who would have thought, for example, that Chinese coal use could drop 7.4% in a year? Happily, that’s just what happened in April 2015.  Who would have thought that the US auto industry could retool from making millions of cars per year to building war machines in 6 months? Yet that’s what happened soon after the US entered World War II.  In both cases, what seemed impossible looking forward became possible when people put their minds to it (and policy makers pushed for big changes)

I would rephrase Roberts’ summary to say “we can avoid some awful shit if we just get our act together, and the only thing standing in the way is our willingness to face the reality of the climate problem.”  Whether we can meet the 2 C warming limit is something that cannot be accurately predicted in advance, it can only be determined by making the attempt.  Modeling exercises can be useful, but it is only by trying to reduce emissions that we can determine what is possible.

Our choices today affect our options tomorrow.  If we choose wisely, we can still avoid the worst consequences of climate change, but we must choose.  We are out of time, and the time for choice is now.

References

[1] Koomey, Jonathan. 2002. "From My Perspective: Avoiding "The Big Mistake” in Forecasting Technology Adoption.“  Technological Forecasting and Social Change.  vol. 69, no. 5. June. pp. 511-518.

[2] Struck, Doug. 2011. "Climate Scientist Fears His ‘Wedges’ Made It Seem Too Easy.” In National Geographic. May 17. [Read online at http://news.nationalgeographic.com/news/energy/2011/05/110517-global-warming-scientist-concern/]

[3] See the recently commissioned Gemasolar plant in Spain for one way to address the storage issue, using molten salt heat storage [http://www.nrel.gov/csp/solarpaces/project_detail.cfm/projectID=40].  There are many other ways, some based on long proven technologies (like pumped storage, flywheels, compressed air, or batteries) and others that are more exotic, like molten salts.

NY Times on smart homes

image

Steve Lohr of the NY Times wrote a nice article about smart homes that will appear in tomorrow’s NY Times business section (April 23, 2015).  The issue for residential efficiency efforts like this is that the savings are often small in absolute terms, and transaction costs can be high.  In the aggregate, however, savings from millions of homes can add up fast.

My own view is that the biggest benefits from such technologies will be in making the grid more flexible and resilient, rather than yielding major energy savings for consumers.  Here’s my quote in the article, surrounded by two other paragraphs, for context:

But the larger benefit of the new home technology may be beyond the home, as it contributes to the ecosystem of energy efficiency. Add up many household energy-saving steps at the right time, and peak loads for utilities are reduced, requiring less power generation. The cleanest, cheapest imaginable power plant is the one that is never built.
“If you can shift the load for a few hours on a summer day, that is a big deal to the utility company,” said Jonathan Koomey, a research fellow at the Steyer-Taylor Center for Energy Policy and Finance at Stanford University. “That’s where the big saving (sic) is going to be.”
Utilities across the country recognize the potential. Many are beginning to offer reward programs for households using their smart thermostats to curb energy use during peak hours and sometimes rebates for the purchase of Internet-connected thermostats from Nest, Honeywell, Ecobee and others.

Read more…

See also our 2013 article in the Annual Review of Environment and Resources titled “Smart Everything”.

Blog Archive
Stock1

Koomey researches, writes, and lectures about climate solutions, critical thinking skills, and the environmental effects of information technology.

Partial Client List

  • AMD
  • Dupont
  • eBay
  • Global Business Network
  • Hewlett Packard
  • IBM
  • Intel
  • Microsoft
  • Procter & Gamble
  • Rocky Mountain Institute
  • Samsung
  • Sony
  • Sun Microsystems
  • The Uptime Institute