My oped, out this week: "On climate we're in a hole. Let's stop digging"
I just had an oped on climate accepted by the McClatchy-Tribune News service, and it was picked up by at least 15 regional papers, including the Sacramento Bee (California), The Wichita Eagle and Kansas.com (Kansas), The Charlotte Observer (North Carolina), News OK (Oklahoma), Kentucky.com (Kentucky), Albany Times Union (New York), and North Jersey.com (New Jersey).
My friends at Climate Nexus, who successfully pitched the article, say this is excellent pickup for an oped like this (and a few more papers may follow in the next day or two). Philip Newell and Dianne Saenz were also helpful in guiding the article towards the right focus (on how we get out of this hole we’ve dug ourselves into).
Here’s the oped, along with the footnotes supporting the claims I make there. The opeds themselves as published don’t have the footnotes of course, but having them online may be useful to some who want to dig into my conclusions.
________________________________________________________________
On climate we’re in a hole. Let’s stop digging
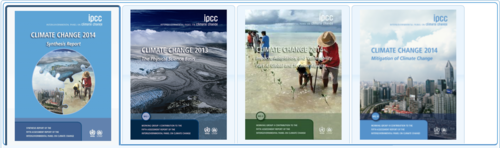
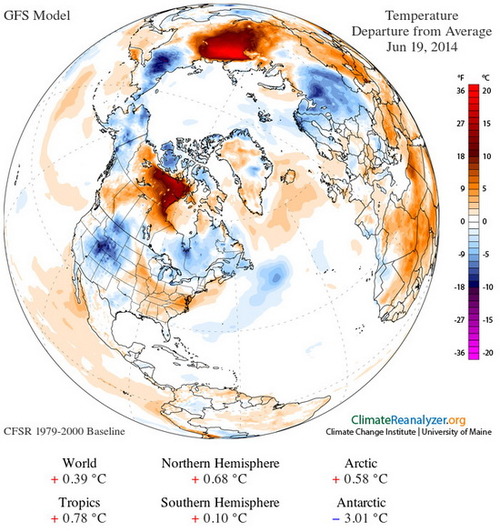
The Intergovernmental Panel on Climate Change (IPCC) just released its Fifth Assessment Report, summarizing the state of climate science and solutions. The report reinforces previous findings that the earth is warming, humans are primarily responsible, and rapid reductions in emissions are urgently needed.[i] Our current emissions trend increases substantially the risk of costly, dangerous, irreversible, and potentially catastrophic changes in the global life support systems upon which we all depend.
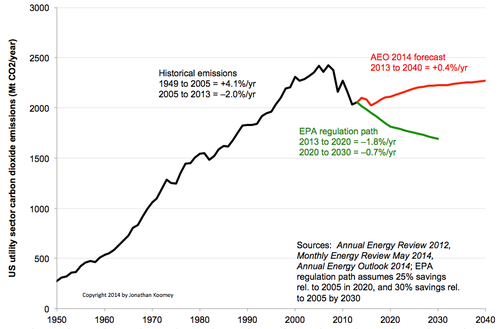
We’ve dug ourselves into a deep climate hole. Despite ever more dire warnings, greenhouse gas (GHG) emissions have grown 42% since the IPCC’s first assessment report in 1990.[ii] Preserving a safe climate means turning global GHG emissions down this decade and reducing them rapidly in absolute terms over the next 40 years, even as GDP and population increase.[iii] It also means keeping three quarters of proved reserves of fossil fuels in the ground, or safely storing the emissions from burning those fuels.[iv]
The science summarized by the IPCC gives clear guidance for what to do next:
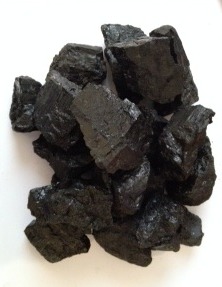
Stop new digging. The more high-emissions infrastructure we build now, the more we’ll have to scrap in coming decades,[v] so let’s stop building it as soon as we can. That means no new coal-fired power plants, no new shipping terminals to move coal overseas, no more pipelines or rail lines to unconventional oil supplies, and no drilling for oil in the soon-to-be ice-free Arctic. It will be difficult to stop these projects, but once built, they will be even harder to shut down. Better to not build them in the first place.
Charge the full cost of digging. To stabilize the climate, we need policies consistent with a low emissions world (like those now in place in California), including prices on greenhouse gas emissions and other pollutants, as well as vigorous enforcement of existing and even stricter safety and environmental regulations. That also means ditching the “all of the above” energy strategy in the US, where fossil fuels are supported on a coequal basis with non-fossil sources of energy.[vi] Subsidies for fossil fuels need to disappear.[vii] Mountaintop removal coal mining[viii] and single-bid auctions of fossil fuels on public lands[ix] need to stop. And bonding requirements for US natural gas drilling companies, last set in 1960 and never adjusted for inflation, need to increase substantially.[x]
Climb out with alternatives. Existing clean energy technologies already offer many opportunities in both developed and developing economies, and costs are dropping fast. Wind generation is now competitive with conventional sources[xi], even without counting the latter’s pollution costs[xii], and solar is not far behind[xiii]. Deploying distributed renewable electricity in microgrids is often cheaper than extending the central electric grid in the developing world.[xiv] Energy efficiency remains the cheapest, cleanest, fastest emissions reduction resource, with innovation (especially in information technologies[xv]) delivering more and better efficiency options with each passing day.[xvi] Retrofitting existing hydro facilities is simple and cost effective.[xvii] Cogeneration of heat and power remains underused.[xviii] And if the nuclear industry can build plants as quickly, as cheaply, and as safely as they say they can, that technology might also help.[xix]
Surviving this stage of human development means we’ll need to evolve as a species to learn how to face challenges like this one, trying many things, failing fast, and doing more of what works and less of what doesn’t. We’ll need to foster rapid innovation, fierce competition, and active coordination, all at the same time. We’ll also need to reassess our responsibilities to each other, to the earth, and to future generations. And we’ll need to explore innovations in our values, our behaviors, and our institutions, which can be as powerful as those for new technologies in opening up possibilities for the future.
Today’s technology now allows us to move past combustion in most applications, but scaling it up to meet the demands of a modern industrial society won’t be easy. Of course, not doing so will be harder still, because of the damages unrestricted climate change will inflict on the earth and on human society.[xx]
The new IPCC Synthesis Report shows how to climb out of this hole. But first we need to stop digging.
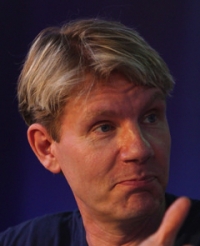
Author’s biography
Jonathan Koomey, Ph.D, is a Research Fellow at the Steyer-Taylor Center for Energy Policy and Finance, Stanford University, and author of Cold Cash, Cool Climate: Science-based Advice for Ecological Entrepreneurs
[ii] http://cdiac.ornl.gov/GCP/carbonbudget/2014/
[iii] Koomey, Jonathan G. 2012. Cold Cash, Cool Climate: Science-Based Advice for Ecological Entrepreneurs. Burlingame, CA: Analytics Press. [http://www.analyticspress.com/cccc.html]
[iv] Koomey, Jonathan G. 2012. Cold Cash, Cool Climate: Science-Based Advice for Ecological Entrepreneurs. Burlingame, CA: Analytics Press. [http://www.analyticspress.com/cccc.html]
McKibben, Bill. 2012. “Global Warming’s Terrifying New Math.” In Rolling Stone Magazine. July 19. pp. [http://www.rollingstone.com/politics/news/global-warmings-terrifying-new-math-20120719]
Gore, Al, and David Blood. 2013. “The Coming Carbon Asset Bubble.” The Wall Street Journal (online). October 29. [http://online.wsj.com/news/articles/SB10001424052702304655104579163663464339836?mod=hp_opinion]
[v] Steven, J. Davis, and H. Socolow Robert. 2014. “Commitment accounting of CO 2 emissions." Environmental Research Letters. vol. 9, no. 8. pp. 084018. [http://stacks.iop.org/1748-9326/9/i=8/a=084018]
Luderer, Gunnar, Robert C. Pietzcker, Christoph Bertram, Elmar Kriegler, Malte Meinshausen, and Ottmar Edenhofer. 2013. "Economic mitigation challenges: how further delay closes the door for achieving climate targets." Environmental Research Letters. vol. 8, no. 3. September 17. [http://iopscience.iop.org/1748-9326/8/3/034033/article]
Koomey, Jonathan G. 2012. Cold Cash, Cool Climate: Science-Based Advice for Ecological Entrepreneurs. Burlingame, CA: Analytics Press. [http://www.analyticspress.com/cccc.html]
[vi]http://www.whitehouse.gov/blog/2014/05/29/new-report-all-above-energy-strategy-path-sustainable-economic-growth
[vii] http://www.worldenergyoutlook.org/resources/energysubsidies/
[viii] http://www.smithsonianmag.com/ecocenter-energy/mining-the-mountains-130454620/?no-ist
[ix] http://thinkprogress.org/climate/2013/08/21/2499291/obama-major-coal-sales/
[x] Davis, Lucas. 2012. Modernizing Bonding Requirements for Natural Gas Producers. The Hamilton Project. Discussion Paper 2012-02. June. [http://www.hamiltonproject.org/files/downloads_and_links/06_bonds_davis.pdf]
[xi] http://thinkprogress.org/climate/2013/02/10/1566881/in-australia-wind-power-is-already-cheaper-than-fossil-fuels-and-solar-is-right-behind/
http://thinkprogress.org/climate/2014/07/22/3462852/onshore-wind-cheapest-denmark/
[xii] Muller, Nicholas Z., Robert Mendelsohn, and William Nordhaus. 2011. "Environmental Accounting for Pollution in the United States Economy." American Economic Review vol. 101, no. 5. August. pp. 1649–1675. [https://www.aeaweb.org/articles.php?doi=10.1257/aer.101.5.1649]
Epstein, Paul R., Jonathan J. Buonocore, Kevin Eckerle, Michael Hendryx, Benjamin M. Stout Iii, Richard Heinberg, Richard W. Clapp, Beverly May, Nancy L. Reinhart, Melissa M. Ahern, Samir K. Doshi, and Leslie Glustrom. 2011. "Full cost accounting for the life cycle of coal." Annals of the New York Academy of Sciences. vol. 1219, no. 1. February 17. pp. 73-98. [http://dx.doi.org/10.1111/j.1749-6632.2010.05890.x]
[xiii] http://theenergycollective.com/stephenlacey/2144606/georgia-latest-state-procure-dirt-cheap-solar-power
[xiv] http://www.technologyreview.com/featuredstory/429529/how-solar-based-microgrids-could-bring-power-to-millions/
[xv] Koomey, Jonathan. 2012. "The Computing Trend that Will Change Everything.” In Technology Review. May/June. pp. 76-77. [http://www.technologyreview.com/news/427444/the-computing-trend-that-will-change-everything/]
[xvi] http://www.iea.org/topics/energyefficiency/
Lovins, Amory B., Mathias Bell, Lionel Bony, Albert Chan, Stephen Doig, Nathan J. Glasgow, Lena Hansen, Virginia Lacy, Eric Maurer, Jesse Morris, James Newcomb, Greg Rucks, and Caroline Traube. 2011. Reinventing Fire: Bold Business Solutions for the New Energy Era. White River Junction, VT: Chelsea Green Publishing. [http://www.rmi.org/ReinventingFire]
[xvii] http://energy.gov/sites/prod/files/2013/12/f5/doewater-11673.pdf
[xviii] http://www.aceee.org/topics/chp
[xix] Koomey, Jonathan, and Nathan Hultman. 2009. The Real Risk of Nuclear Power. Washington, DC: The Brookings Institution. December 2. [http://www.brookings.edu/opinions/2009/1202_nuclear_power_hultman.aspx]
Koomey, Jonathan G., and Nathan E. Hultman. 2007. “A reactor-level analysis of busbar costs for U.S. nuclear plants, 1970-2005." Energy Policy. vol. 35, no. 11. November. pp. 5630-5642. [http://dx.doi.org/10.1016/j.enpol.2007.06.005]
http://thinkprogress.org/climate/2014/10/14/3568601/pro-collapse-capitalism-polluters/


