A look at historical global trends in energy and emissions
As part of our work decomposing growth in greenhouse gas emissions into its key factors that was published in 2019 [1], we delved into historical data to create benchmarks against which trends in scenario projections could be compared. For our historical trends we relied on the long term data in the Primary, Final, and Useful (PFU) energy database, from IIASA. That data source goes back many decades, which makes it unique among such data sources
Before our article was published we examined comparable historical energy balance data from the International Energy Agency to see what it could tell us. The IEA global energy balances don’t go back as far as the PFU data, but are more detailed in some ways. This post describes the high level results from that review.
First, let’s look at an equation known as the Kaya Identity, which describes fossil carbon emissions as the product of four terms: Population, GDP/person (wealth), Primary Energy/GDP, and Carbon dioxide emissions/primary energy.

Over time, analysts have realized that this four-factor identity collapses some important information. That’s why, in our 2019 article, we moved to the expanded Kaya identity, with several more terms:

The components of this identity are as follows:
CFossil Fuels represents carbon dioxide (CO2) emissions from fossil fuels combusted in the energy sector,
P is population,
GWP is gross world product (measured consistently using Purchasing Power Parity here),
FE is final energy,
PE is total primary energy, calculated using the direct equivalent (DEq) method (electricity from non-combustion resources is measured in primary energy terms as the heat value of the electricity to first approximation),
PEFF is primary energy associated with fossil fuels,
TFC is total fossil CO2 emitted by the primary energy resource mix,
NFC is net fossil CO2 emitted to the atmosphere after accounting for fossil sequestration.
For historical data, there is no sequestration of carbon dioxide emissions, so the last term is dropped in our graphs below.
Note that this identity applies only to carbon dioxide emissions from the energy sector. We use an additional additive dashboard for future scenarios to describe industrial process emissions, land use changes, and effects of other greenhouse gases, but we haven’t yet compiled those additional data for historical analysis and we only present the graphs for energy sector total fossil carbon dioxide emissions here.
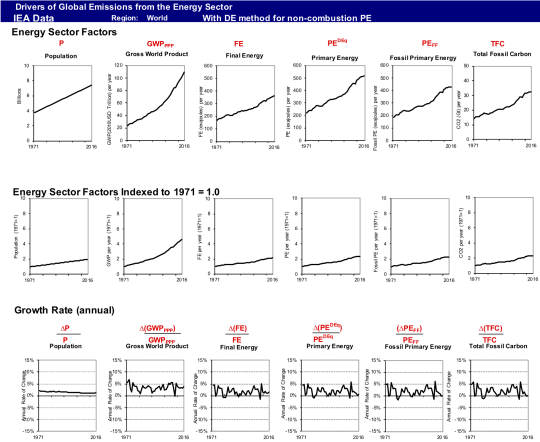
The first graph is what we call our graph of key factors, from the indented list above. In the first row we show each term in its raw form. The second row shows indices with 1971 = 1.0. And the last term shows the annual rate of change in each term.
The total fossil carbon is the end result of the other factors, which drive emissions. It grows by about a factor of two from 1971 to 2016.

Download higher resolution version of Energy Sector Factors
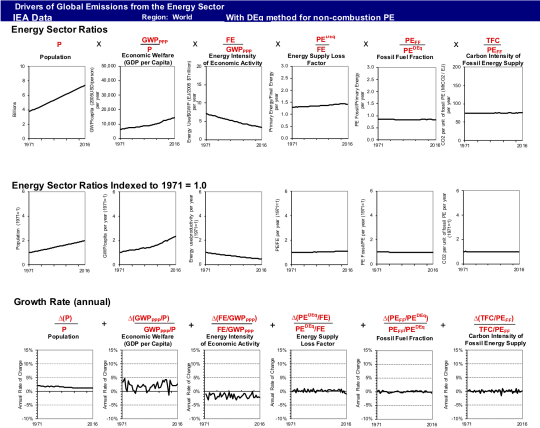
The 2nd graph below shows the expanded Kaya identity ratios. Population is the same, but all the other columns show ratios from the 2nd equation above. Population and wealth per person (the first two terms in the Kaya identity) are the biggest drivers of emissions, while the energy intensity of economic activity declines to offset some of the growth in the first two terms. The other terms don’t show much change over the past 45 years.
Quantitatively, population and GWP per person both roughly double, while energy intensity of economic activity drops by half, with other factors roughly constant. That is consistent with Total Fossil Carbon increasing by a factor of two over this period.

Download higher resolution version of Energy Sector Ratios
These graphs are a handy summary of key historical data from IEA. If you want to see the longer term trends from IIASA’s PFU data, please email me and I’ll send you a copy of our 2019 article, which has those graphs. Happy to share the spreadsheets + graphs for those interested.
References
1. Koomey, Jonathan, Zachary Schmidt, Holmes Hummel, and John Weyant. 2019. “Inside the Black Box: Understanding Key Drivers of Global Emission Scenarios.” Environmental Modeling and Software. vol. 111, no. 1. January. pp. 268-281. [https://www.sciencedirect.com/science/article/pii/S1364815218300793]
