A quick investigation of solar PV projections in the International Energy Agency’s World Energy Outlook
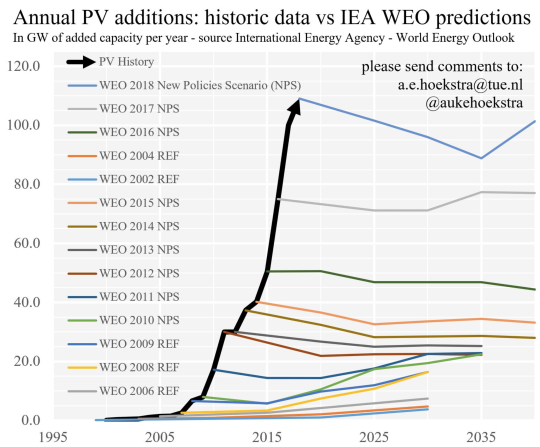
My colleague @AukeHoekstra (on Twitter) has for several years produced a graph of the International Energy Agency’s (IEA’s) projections of global photovoltaic (PV) installations. The graph has become iconic. Auke documents his methods here.

The graph shows that IEA’s projections in their “New Polices Scenario” indicate that annual installations of PVs will stay constant at current historical levels. Every year as actual shipments grow rapidly, IEA ramps up its starting point to reflect historical data, but never seems to adjust the projection’s general trend after the first year of the projection.
This is a puzzling graph to those of us who understand historical technology trends for mass produced products like PVs. In this post, I’ll explore briefly why I think so.
First, it’s important to understand IEA’s terminology for their annual World Energy Outlook (WEO). Their “New Policies Scenario” is one in which current policies continue and then are renewed when they would otherwise have expired. It’s a way to characterize a more or less constant policy environment. They also show a “Current Policies Scenario” in which existing policies exist until their expiration date, and then they disappear. They also have a Sustainable Development Scenario in which more aggressive policies are assumed to be implemented than in the New Policies Scenario.
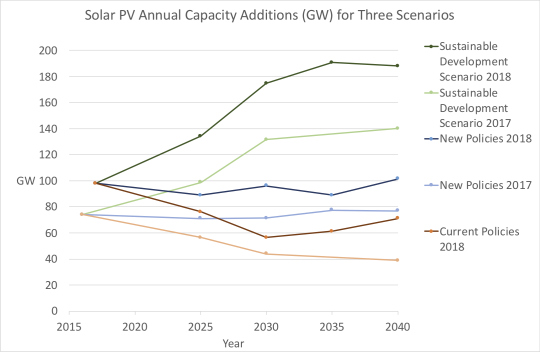
I asked my colleague Zach to plot PV installations for these three scenarios for the WEO 2017 and 2018. The graph below shows the results.

The difference between the Current Policies Scenario and the New Policies Scenario is the expected effect of renewing current policies when they would have otherwise expired. In the 2017 WEO, there’s almost a doubling in annual installations by 2040 in going from Current to New Policies. It’s more like a 50% increase for the 2018 WEO. In both cases, there’s about a doubling in annual installations by 2040 to go from New Policies to the Sustainable Development scenario.
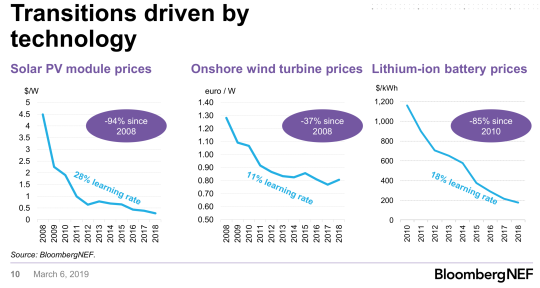
The lesson I take from this is that WEO assumes that policy is the main (and perhaps sole) driver of penetration of renewables. This is odd for those who understand learning rates for mass produced technologies. When the cumulative production of a mass produced device doubles, its cost per unit declines by a more or less predictable amount. For PVs, that cost decline is 20-25% per doubling of cumulative production historically.

Why wouldn’t penetration of PVs increase if annual installations stayed in the 100 GW range for two decades? Cost per unit would come down significantly in such a scenario, so there’s a real inconsistency here that needs further investigation.
It’s also counterintuitive that exponential growth in annual sales of PVs would immediately be followed by zero growth in annual sales forever more. The idea, I think, is that the growth is policy driven, so that if you don’t accelerate the policies then there won’t be any more growth. But if historical growth is solely policy driven, why wouldn’t that growth continue as it has for the past decade if you maintain current policies? It’s another contradiction in the logic of the projections.
One possible explanation is that IEA’s model may have arbitrary internal constraints that prevent variable renewables from penetrating the market more than a certain fraction to reflect the complexities of integrating these technologies into current electricity grids. It is not clear why these constraints should kick in immediately once a scenario starts. They clearly haven’t been affecting growth much so far!
Unfortunately, those constraints are rarely reflective of actual constraints in the real world. Most models have such constraints, but they say more about the modelers’ limited understanding of power systems and renewables than they do about actual constraints. We will increasingly need to examine and abandon those arbitrary modeling constraints as the penetration of variable renewables increases.
For those who want a detailed historical example of arbitrary constraints in a widely used energy model, see our 1999 Lawrence Berkeley National Laboratory (LBNL) report on wind energy in the Energy Information Administration’s National Energy Modeling System (NEMS) [1]. As I recall, we found three levels of arbitrary penetration constraints in NEMS that prevented wind adoption even when our scenarios included high carbon taxes.
Something is clearly amiss with IEA’s projections for PV adoption, and I would be very surprised if similar issues don’t exist for wind and electricity storage. In a time of rapid technological change, it isn’t wise to rely on things staying static. The only thing constant is change!
References
1. Osborn, Julie, Frances Wood, Cooper Richey, Sandy Sanders, Walter Short, and Jonathan G. Koomey. 2001. A Sensitivity Analysis of the Treatment of Wind Energy in the AEO99 Version of NEMS. Berkeley, CA: Ernest Orlando Lawrence Berkeley National Laboratory and the National Renewable Energy Laboratory. LBNL-44070. January. [https://emp.lbl.gov/publications/sensitivity-analysis-treatment-wind]
