An Update On Trends In US Primary Energy, Electricity, And Inflation-Adjusted GDP Through 2018
Back in 2015, Professor Richard Hirsh (Virginia Tech) and I published the following article in The Electricity Journal, documenting trends in US primary energy, electricity, and real (inflation-adjusted) Gross Domestic Product (GDP) through 2014:
Hirsh, Richard F., and Jonathan G. Koomey. 2015. “Electricity Consumption and Economic Growth: A New Relationship with Significant Consequences?” The Electricity Journal. vol. 28, no. 9. November. pp. 72-84. [http://www.sciencedirect.com/science/article/pii/S1040619015002067]
Every year since, my colleage Zach Schmidt and I have updated the trend numbers for the US using the latest energy and electricity data from the US Energy Information Administration (EIA). The GDP numbers are preliminary, from the US Bureau of Economic Analysis (released 3/28/2019) This short blog post gives the three key graphs from that study updated to 2018, and makes a few observations.
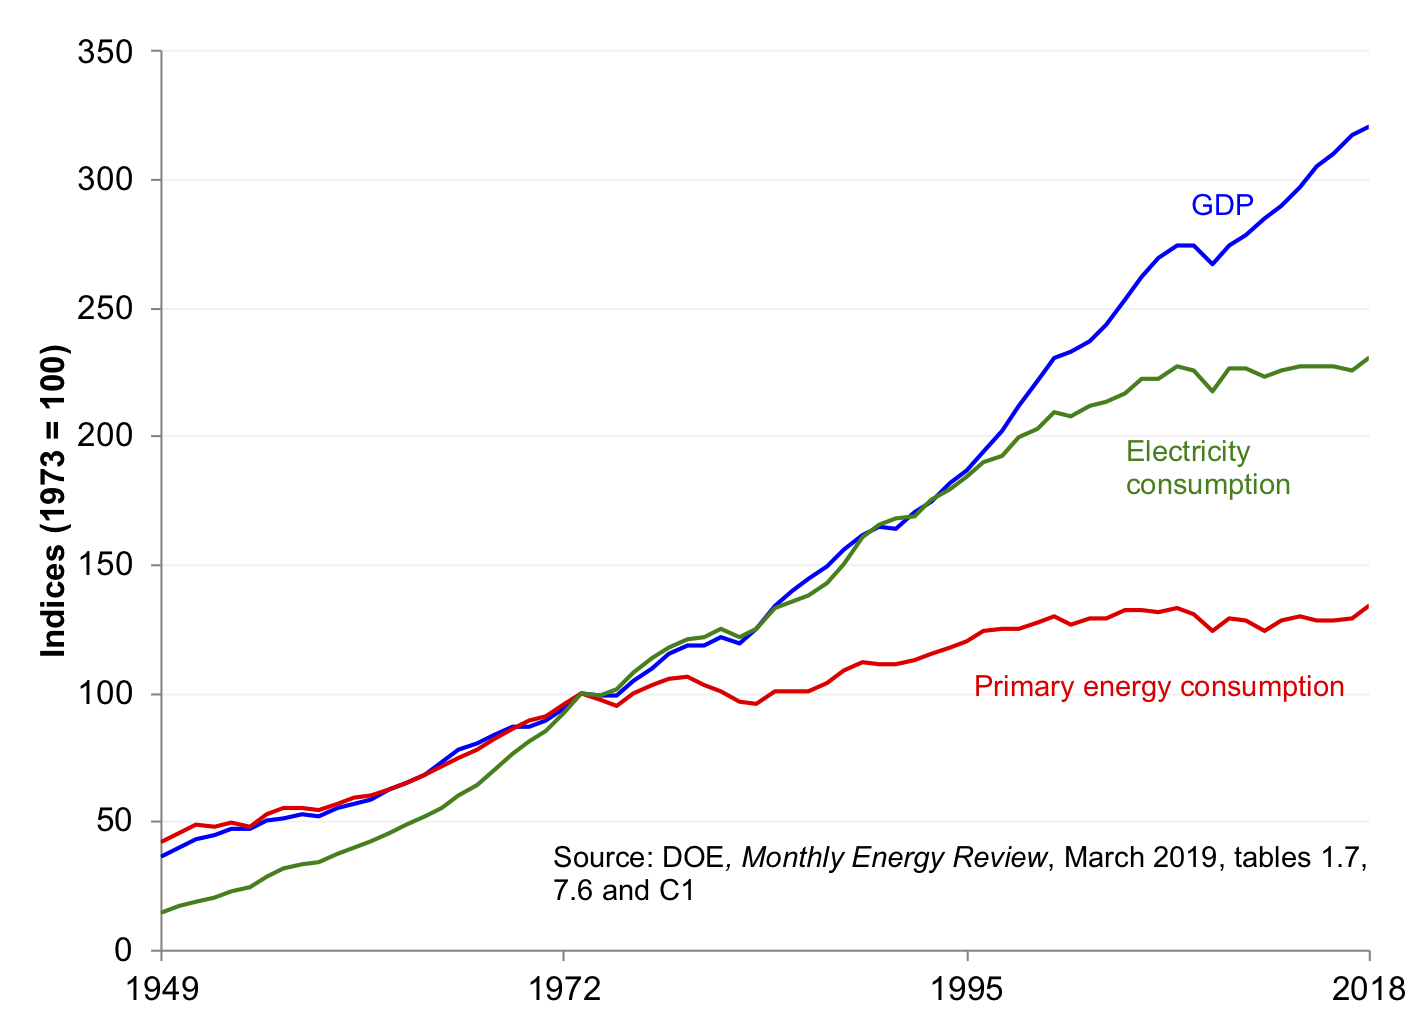
Figure 1 shows GDP, primary energy, and electricity consumption through 2018. From 2017 to 2018, GDP grew a little more slowly and primary energy and electricity grew a little more rapidly than in recent years, resulting in slight changes in the slope of those curves. The overall picture, though, hasn’t changed that much, and we’ll have to see what happens in subsequent years. Electricity consumption and primary energy consumption have been flat for about a decade and two decades (respectively).

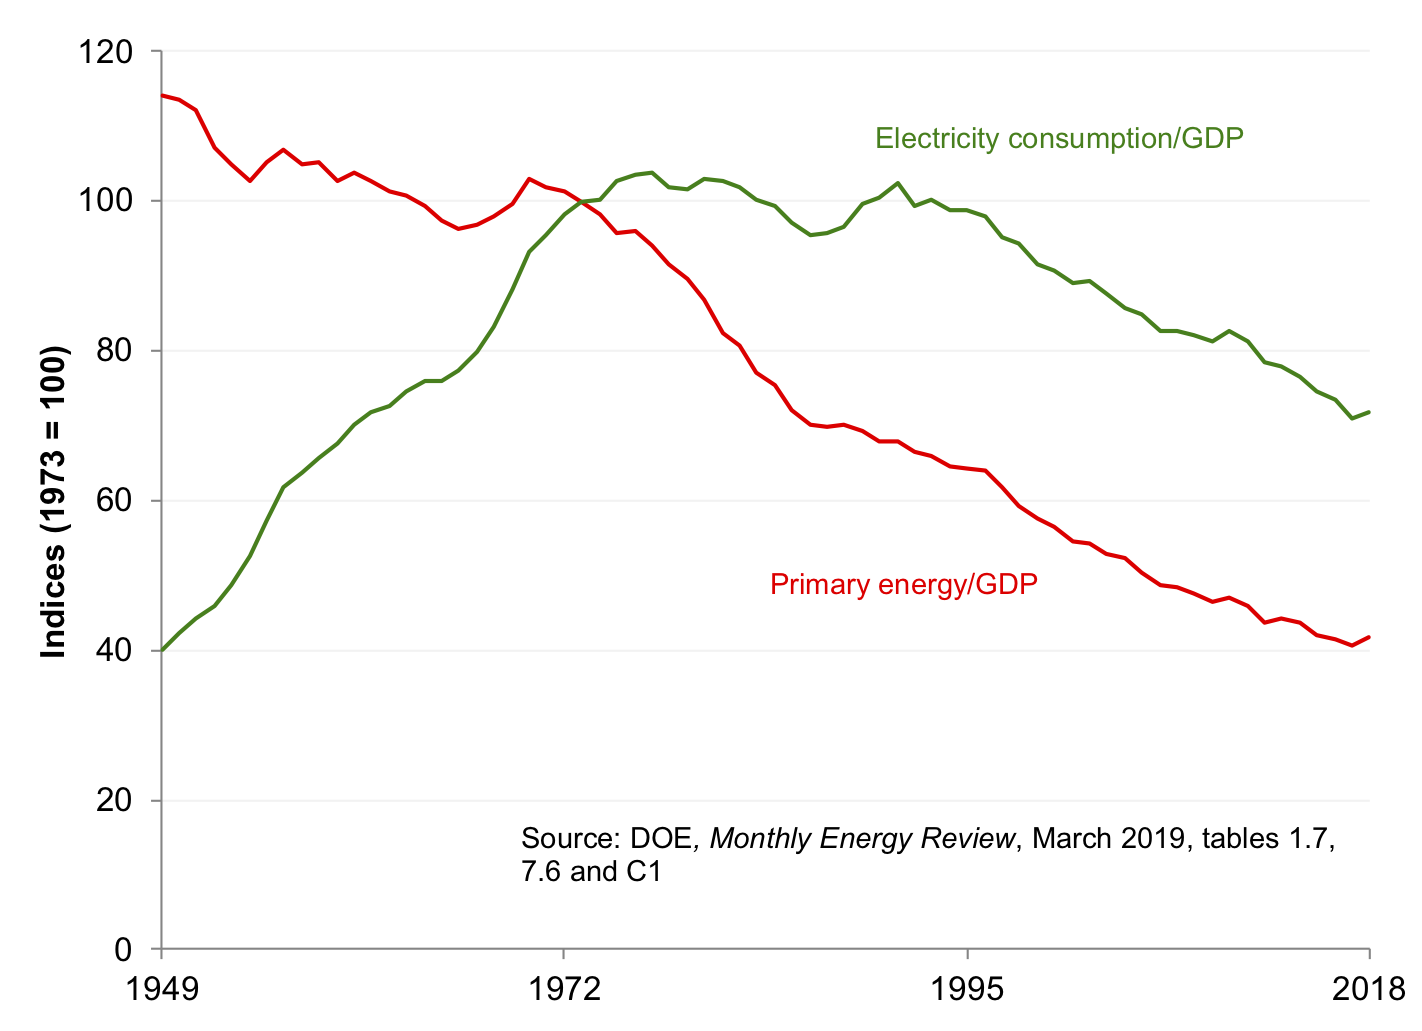
Figure 2 shows the ratio of primary energy and electricity consumption to GDP. The trends there are pretty clear as well. Primary energy use per unit of GDP has been declining since the early 1970s, while the ratio of electricity use to GDP has been declining since the mid 1990s. Before the 1970s, electricity intensity of economic activity was increasing, and from the early 1970s to the mid 1990s, it was roughly constant.

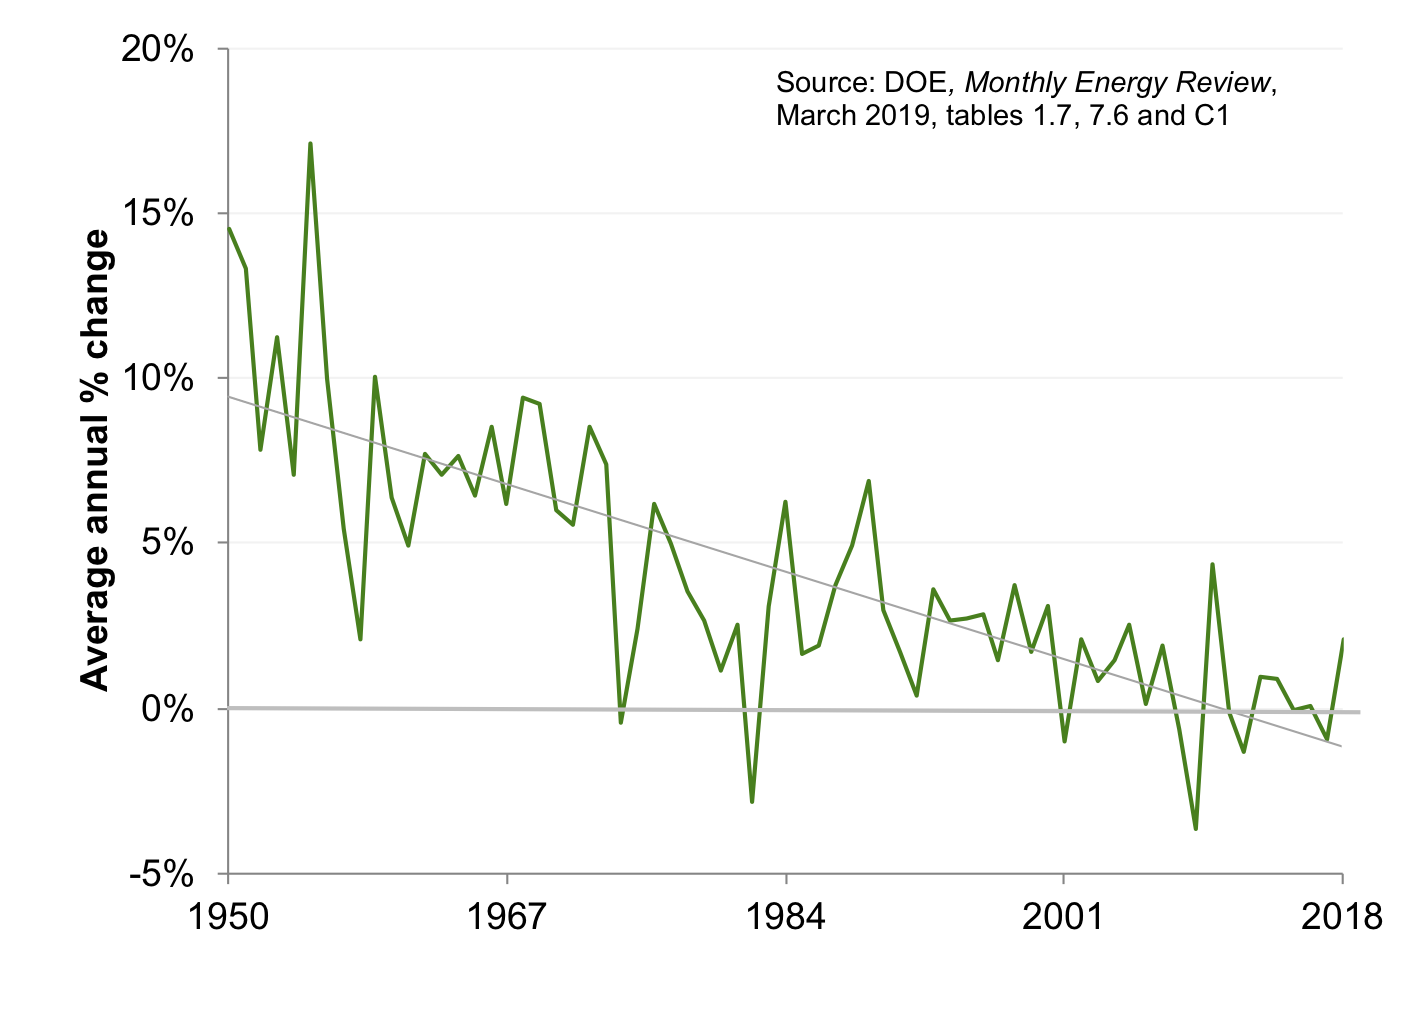
Figure 3 (which was Figure 4 in the Hirsh and Koomey article) shows the annual change in electricity consumption going back to 1950. Growth in total US electricity consumption has just about stopped in the past decade, but there’s significant year-to-year variation. Flat consumption poses big challenges to utilities, whose business models depend on continued growth to increase profits (unless they are in states like California, where the regulators have decoupled electricity use from profits).

Email me at jon@koomey.com if you’d like a copy of the 2015 article or the latest spreadsheet with graphs. If you want to use these graphs, you are free to do so as long as you don’t change the data and you credit the work as follows:
This graph is an updated version of one that appeared in Hirsh and Koomey (2015), using data from the US Energy Information Administration and the US Bureau of Economic Analysis.
Hirsh, Richard F., and Jonathan G. Koomey. 2015. “Electricity Consumption and Economic Growth: A New Relationship with Significant Consequences?" The Electricity Journal. vol. 28, no. 9. November. pp. 72-84. [http://www.sciencedirect.com/science/article/pii/S1040619015002067]
